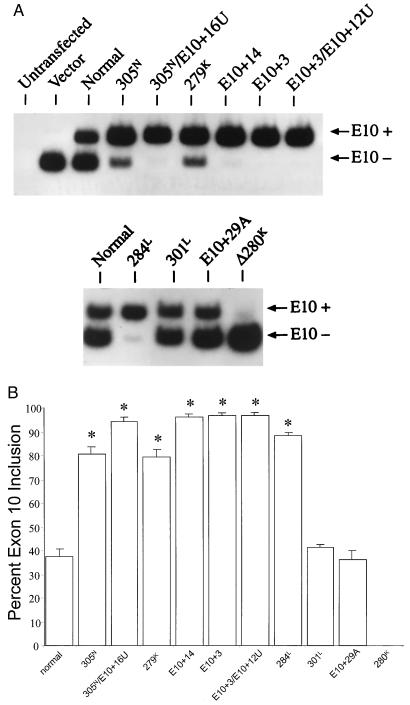
Figure 4.
Affects of E10 mutations on splicing. (A) Autoradiograph of reverse transciption–PCR products from splicing assays. E10− and E10+ transcripts yield 261-bp and 354-bp fragments, respectively. For each construct, where sufficient quantities of each band were present, both E10+ and E10− fragments were excised from gels, and the DNA sequence was determined. In each case, the splicing occurred at the expected sites. (B) Quantitation of E10− and E10+ splicing. Each bar represents the mean of five separate transfection experiments, and 100% is the sum of E10− and E10+. Error bars are the standard deviations. For the comparison of normal tau to mutations, ∗ indicates P < 0.000001. Mutation 301L and polymorphism E10 + 29A were not significantly different from normal tau.

