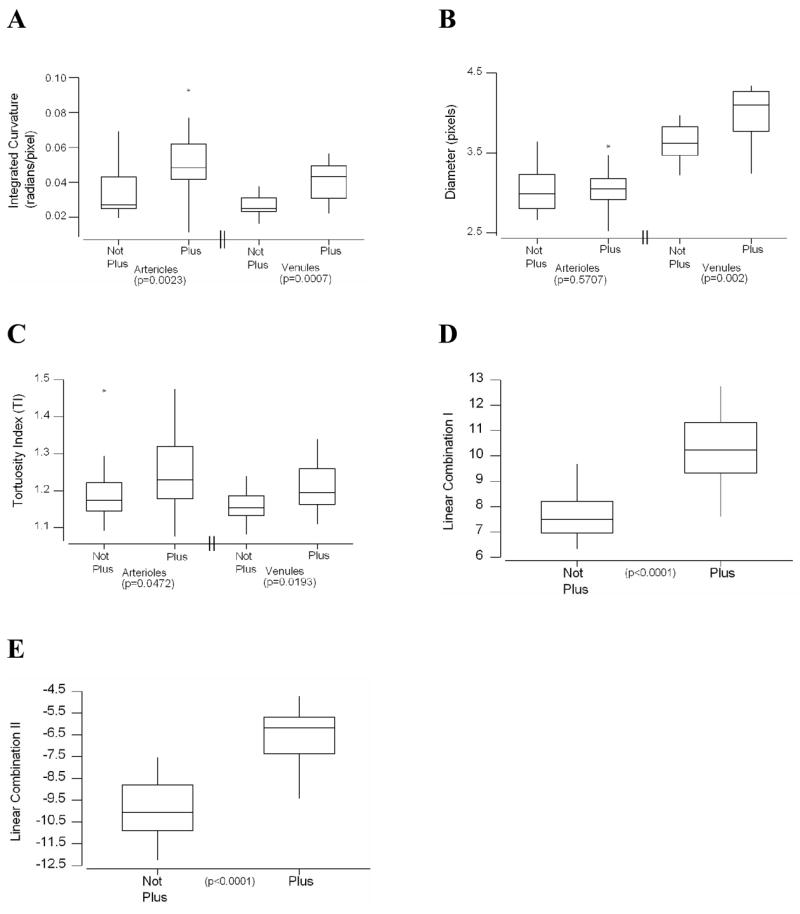
Figure 2. Box plots of computer-based system parameter values in images with “not plus” compared to “plus,” based on reference standard diagnosis.

Individual parameters of (A) integrated curvature (IC), (B) diameter and (C) tortuosity index (TI) for arterioles and venules; as well as combined parameters of (D) Linear combination I (arteriolar IC, venular IC, and venular diameter), and (E) Linear Combination II (arteriolar IC, arteriolar TI, venular IC, venular diameter, and venular TI) are displayed. Boxes represent the 25th, 50th, and 75th percentile values of parameters. Whiskers represent 10th and 90th percentile values. Asterisks represent outlier values. P-values indicated are for Mann-Whitney tests between “not plus” and “plus” groups.
