
Figure 5. Measures of IENFD in SOD2+/+ and SOD2+/− Mice on a C57BL/6 db+ or db/db Background.
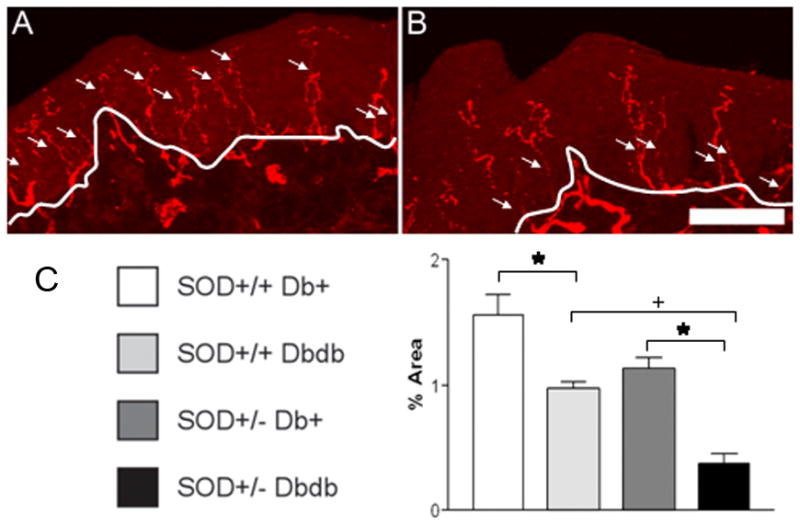
Representative SOD2+/+ db+ (A) and SOD2+/−db/db (B) images are shown to illustrate the flattened confocal mouse footpad sections processed for PGP 9.5 immunofluorescence. The white line in A identifies the division between dermis and epidermis and the arrows indicate IENFD that cross this division. Fewer fibers are evident in the diabetic footpad (B) compared with the non-diabetic control (A). Bar = 50 μm. In C, IENFD expressed as percent of total epidermal area. *p < 0.01 between SOD2+/+ db+ and SOD2+/+ db/db, and between SOD2+/−db+ compared to SOD2+/− db/db. +p < 0.05 between SOD2+/+ db/db compared to SOD2+/− db/db. n=3 for each experimental group.