
Figure 5.
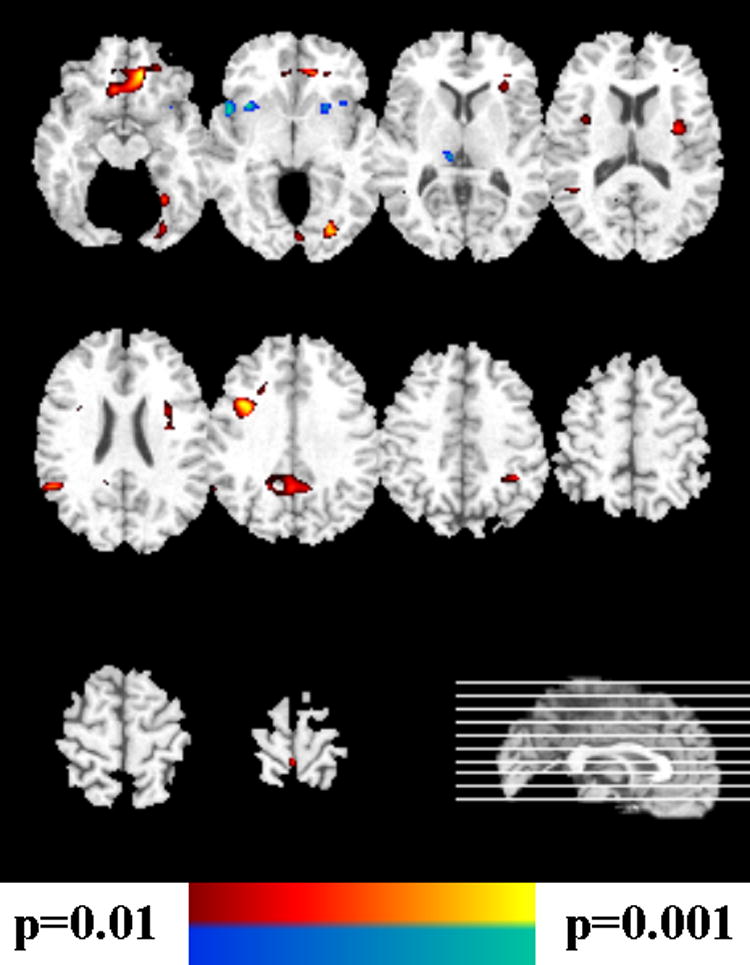
Voxel-based analysis of the GM tissue density maps of Figure 4, bottom row, after correction for multiple comparisons. The yellow-red scale indicates FM>SCZ, and the blue-green scale indicates FM<SCZ.
Official websites use .gov
A
.gov website belongs to an official
government organization in the United States.
Secure .gov websites use HTTPS
A lock (
) or https:// means you've safely
connected to the .gov website. Share sensitive
information only on official, secure websites.
Voxel-based analysis of the GM tissue density maps of Figure 4, bottom row, after correction for multiple comparisons. The yellow-red scale indicates FM>SCZ, and the blue-green scale indicates FM<SCZ.