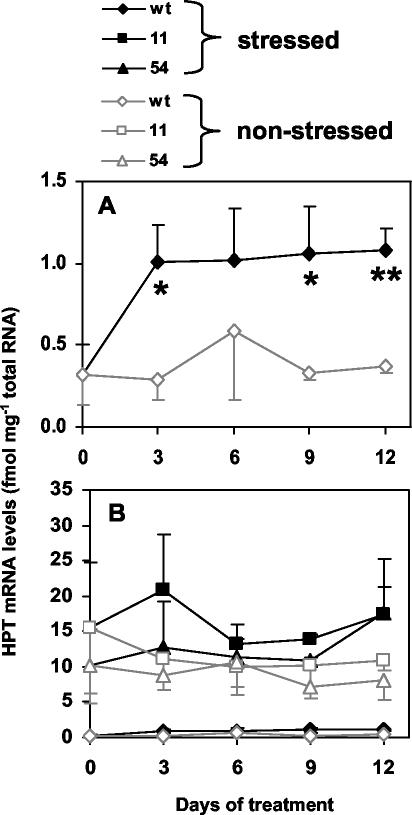
Figure 3.
HPT expression in control and stressed wild-type and 35S::HPT1 plants. Plants were grown and stressed as described in Figure 2, total RNA was extracted, and HPT mRNA levels determined by real-time PCR. Data are normalized for EF-1α mRNA levels and presented as average ± sd of three independent experiments. A, Wild-type HPT mRNA levels. B, Wild-type and 35S::HPT1 HPT mRNA levels. Stress resulted in an up-regulation of HPT mRNA levels in wild type, whereas no trend was observed in stressed 35S::HPT1 and the corresponding control plants. * and ** represent P < 0.05 and 0.01, respectively.

