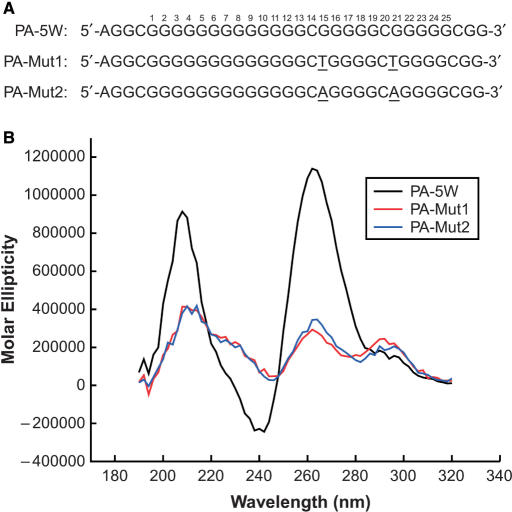
Figure 6.
Sequences (A) and comparative CD spectra (B) of the wild-type sequence of the three 5′-end runs of guanines and the G15/G21 double mutation sequences in the presence of 100 mM KCl. Black line = wild-type sequence PA-5W, red line = double G-to-T mutation sequence PA-Mut1 and blue line = double G-to-A mutation sequence PA-Mut2. All CD data were obtained with a 5 μM strand concentration at 25°C.

