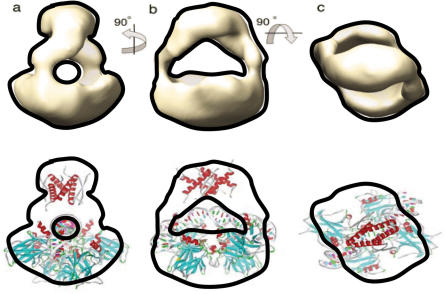
Figure 7.
Upper panel: EM image of p53 tetramer in p53–DNA complex in solution, reference (48). (Reproduced with permission). The see-through channel in the EM map indicates the possible DNA position. Lower panel: fit of p53–DNA complex in H14 binding mode to the EM image in the upper panel. The tetramerization domain was added to the Puma BS2–p53 core domain tetramer in Figure 3.

