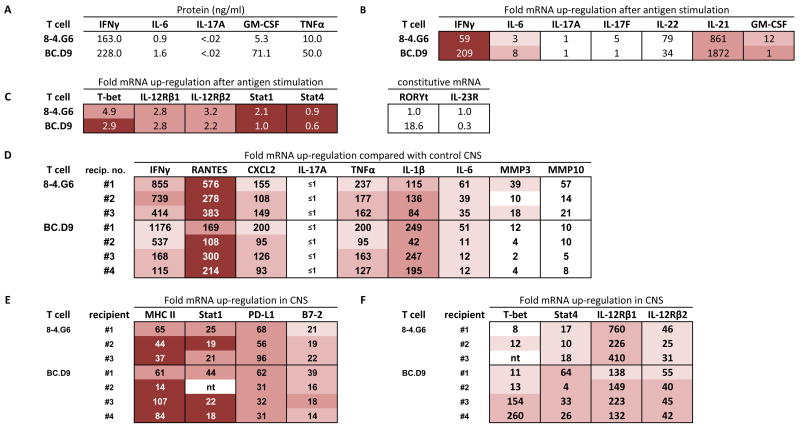
Figure 2.
Expression profiles of TH1 cells in vitro (A, B, C) and genes up-regulated in CNS tissue of TH1-induced EAE (D, E, F). (A) ELISA quantitation of supernatants collected 40 hours after activation of T cell clones with MBP peptides (10 μg/ml) and irradiated BALB/c spleen. None of the cytokines were detectable without addition of antigen. (B) Real time PCR analysis of cytokine gene expression 24 hours after activation with antigen and irradiated spleen cells in vitro. mRNA expression is given as fold up-regulation by T cells with antigen compared with T cells incubated in the absence of antigen (both with irradiated antigen presenting cells); a value of 1 indicates that expression after antigen stimulation is the same as expression without antigen. For in vitro cultured cells, this calculated value of fold-up-regulation uses 18S rRNA as housekeeping gene to normalize values. For expression levels, actual Ct values are shown (cDNA from in vitro cultured cells was used at 1/10; Ct of housekeeping gene is nearly identical for each sample shown, within a value of 0.5, and therefore not subtracted). Intensity of shading correlates with intensity of expression level. Lowest Ct values (16–22) are most deeply shaded; three intermediate levels of decreasing shading indicate, respectively, Ct values of 22–26, 26–28, and 28–30. No shading indicates Ct >30. (C) Realtime PCR analysis of up-regulation (after antigen-specific activation, compared with no antigen addition, normalized with 18S rRNA) and expression level (Ct value) of T-bet, IL-12R chains, Stat1, and Stat4. Levels of RORγt and IL-23R did not increase after activation, therefore relative constitutive levels are arbitrarily compared between each T cell and clone 8-4.G6, which had a basal Ct value of 40. (D,E,F) Realtime PCR analysis of gene expression level (Ct value) and fold up-regulation of each gene in CNS of sick mice, compared with expression levels in normal CNS tissue. GAPDH is used as the housekeeping gene for normalization of in vivo tissue. Brain and spinal cord were harvested at first onset of clinical signs of EAE, and cDNA combined in 1:1 ratios for PCR analysis of each BALB/c recipient. Combined cDNA was used at 1/100 dilution.

