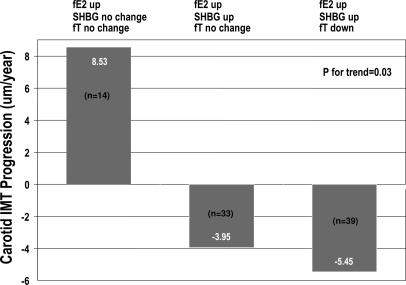
Figure 1.
Change in sex hormones combined with ET and CIMT progression. For each subject, the change in each sex hormone from baseline was categorized using the within-subject sd (over repeated measures) in the placebo group (up = > 1 sd change; down = < 1 sd change; no change = between ± 1 sd). fE2, Free estradiol; fT, free testosterone.

