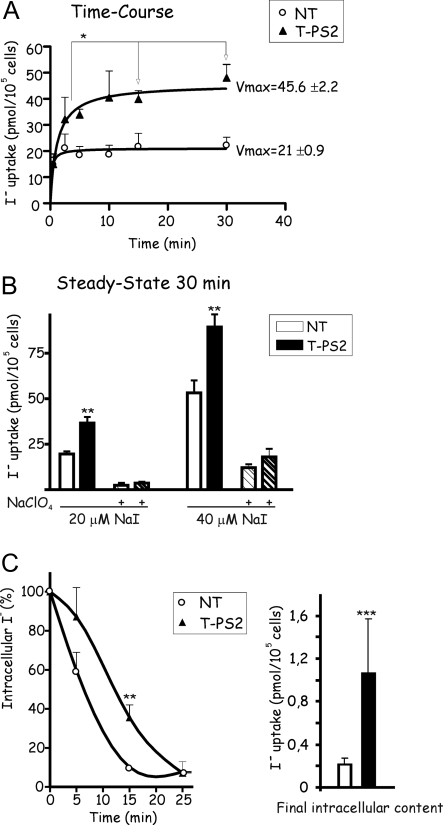
Figure 5.
T-PS2 thyrocytes take up iodide and retain it intracellularly. A, Time course of iodide uptake (20 μm NaI) by thyrocyte lines. Normal NT cells show fast uptake in the first 30 sec, reaching a plateau at 2 min, with no further changes in intracellular iodine content over the remainder of the 30-min experiment (r2 = 0.65); the kinetic curve suggests that, during the first 2 min, NIS transports iodide into NT thyrocytes but that iodide is then effluxed from the cells through pendrin, with the two transporters (NIS and pendrin) then working in opposite directions to maintain equilibrium. In contrast, T-PS2 cells show a progressive increase in iodide uptake, reaching a plateau much later (r2 = 0.99), suggesting a model with a single transporter (NIS); in fact, there were significant differences in intracellular iodine content between the time points 2 or 5 min and the time points 15 or 30 min. Vmax was twice as high for T-PS2 thyrocytes as for NT. B, Steady-state uptake of NaI after incubation for 30 min. At any given concentration of NaI, the intracellular iodide uptake by T-PS2 thyrocytes (black bars) was twice as high as by NT (white bars). In both cell lines, coincubation with 40 μm NaClO4 blocked the iodide uptake (striped bars). C, Efflux of iodide into the culture medium expressed as a percentage of the amount obtained at time 0 after the steady-state uptake using 20 μm NaI. NT thyrocytes released all radioactive iodine to the medium after 15 min of initial washing. T-PS2 released the radioactive iodine much more slowly, so that after 15 min, 40% still remained inside the cells (P < 0.01). Efflux stopped at 25 min, but the residual amount inside the cell at that time was significantly higher in T-PS2 cells (black bars) than in NT cells (white bars).

