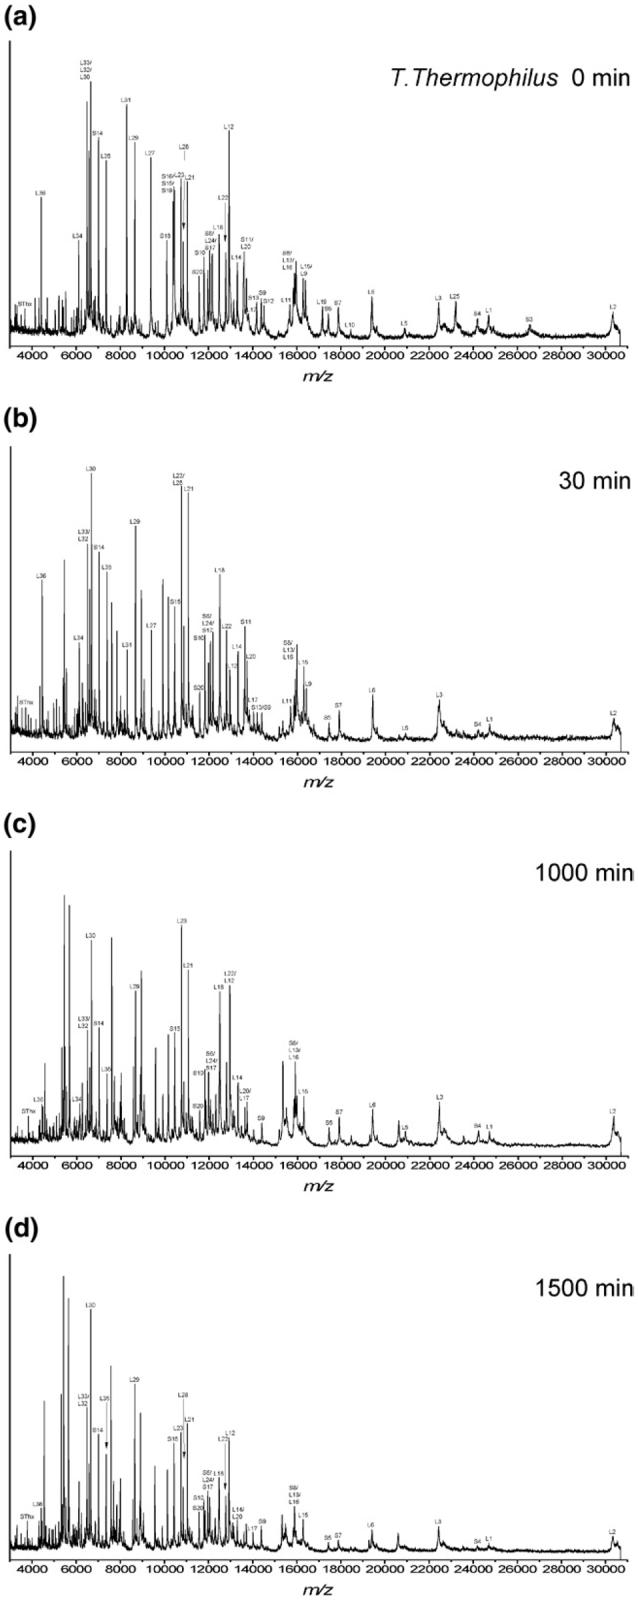
Figure 4.

Representative MALDI mass spectral data after incubation of intact T. thermophilus 70S ribosomes with trypsin under limited proteolysis conditions for the following time periods (a) 0 min, (b) 30 min, (c) 500 min, and (d) 1500 min. The intact ribosomal proteins detected after each incubation period are summarized in Figures 5 and S4. Table 2 summarizes the identification of new m/z values that arise during the limited proteolysis experiments.
