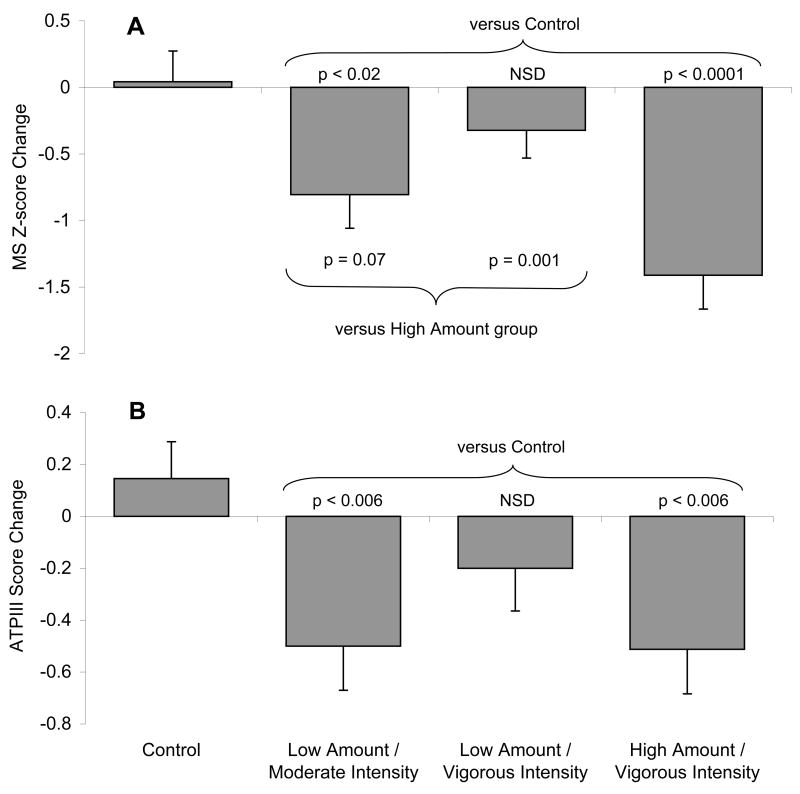
Figure 2.
The effects of exercise amount and intensity on mean changes in MS Z-score (panel A) and ATPIII Score (panel B) are shown. Error bars show SE. Two-way ANOVA for a main group effect was significant (p<0.0005). Post hoc tests for group differences are shown. ANOVA results for gender effect (p=0.70) and gender by group interaction effect (p=0.085) were not significant.

