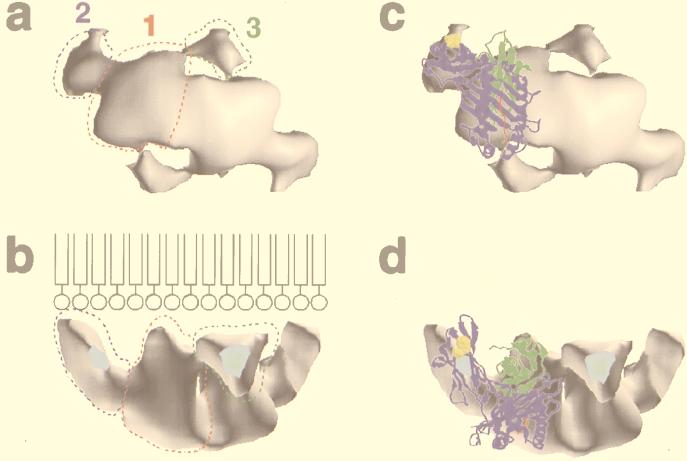
Figure 4.
Views of the three-dimensional reconstruction of H-2Kb [volume visualization program volvis (38)]. The threshold value used to determine the outer surface of the model has been chosen to minimize the contacts between the adjacent unit cells in the crystal. The different domains are shown for one asymmetric unit on a. (a) Top view. (b) Ninety-degree rotation from an horizontal axis. The drawing in b is a representation of the lipid film to show the position of the lipids compared with the protein (not to scale). (c and d) Docking of the crystallographic structure of H-2Kb into the 3D model. c and d correspond to a and b, respectively. The atomic structure of H-2Kb is a ribbon representation. The heavy chain is colored in blue, the β2m in green, and the peptide in red. The 6-histidine tag is not represented but is directly adjacent to the C-terminal residue shown in yellow.

