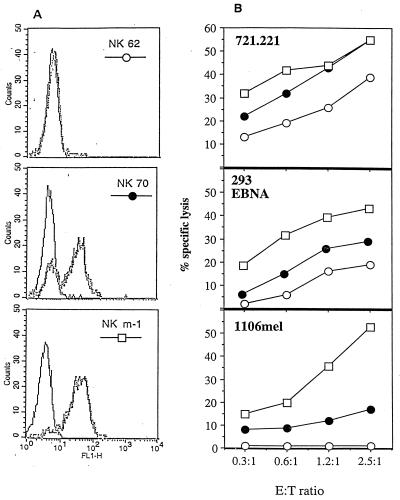
Figure 1.
Relationship between CD16 expression on NK cell lines and lysis of various target cells. (A) FACS analysis of NK lines (NK 62, NK 70, and NK m-1) stained with FITC-labeled anti-CD16 mAb 3G8 (dotted line), overlaid on a control FITC-labeled IgG1 mAb (bold line). FL1-H, fluorescence (FITC). (B) Killing of different target cells by various NK cell lines. E:T ratio, ratio of effector to target cells.

