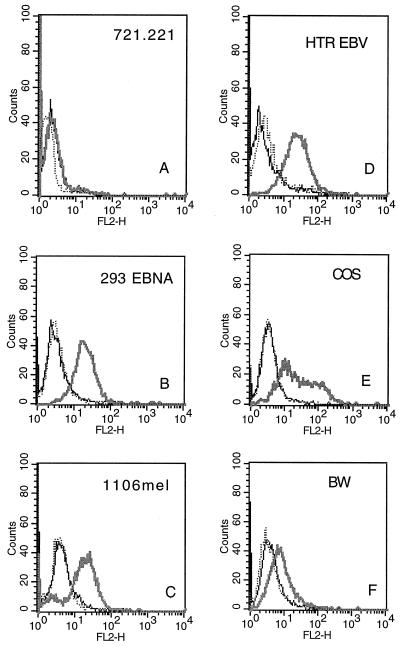
Figure 5.
Staining of various target cells with the CD16-Ig fusion protein. Various target cells were incubated with 50 μg/ml of either the CD16-Ig (thick line) or the CD99-Ig (dotted line) fusion proteins for 1 hr on ice and analyzed by flow cytometry. Controls were the same cells incubated with the secondary mAb alone (thin line). The figure shows one representative experiment of five performed.

