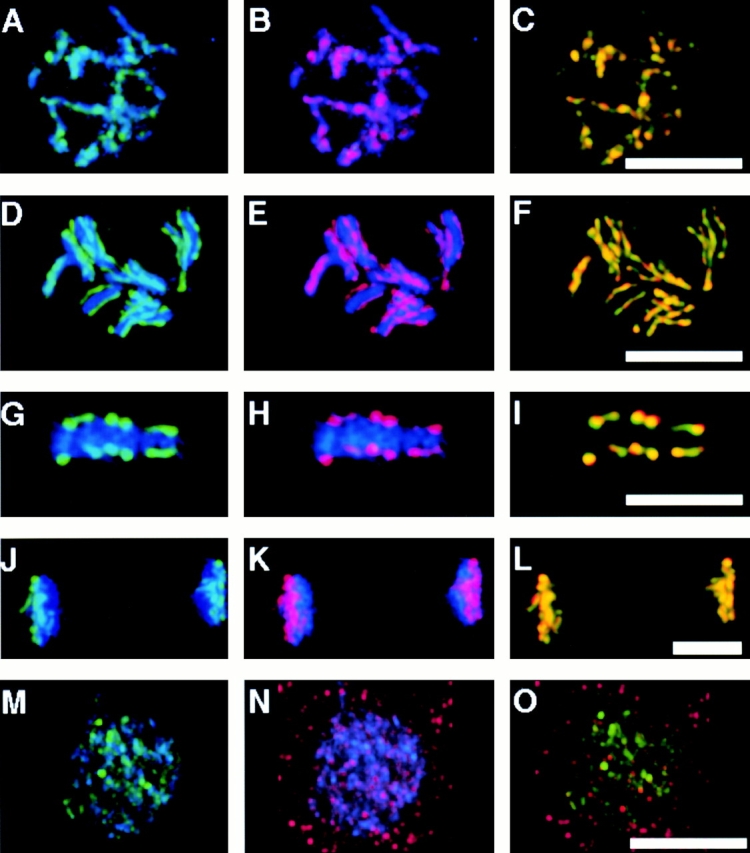
Figure 3.

Centromeric association of HCP-4 during mitosis. Two-cell C. elegans embryos at different stages of the mitotic cell cycle were fixed and stained with α-HCP3 antibody (A, D, G, J, and M, green), α-HCP4 (B, E, H, K, and N, red), and DAPI (blue). Colocalization of HCP-3 and HCP-4 was visualized in the merged images as yellow (C, F, I, L, and O). All images, except metaphase, are a projection of the Z-stack of the entire nucleus. (A–C) Early prophase; (D–F) late prophase; (G–I) metaphase; (J–L) anaphase; (M–O) telophase. Bars, 5 μm.
