
Figure 6.
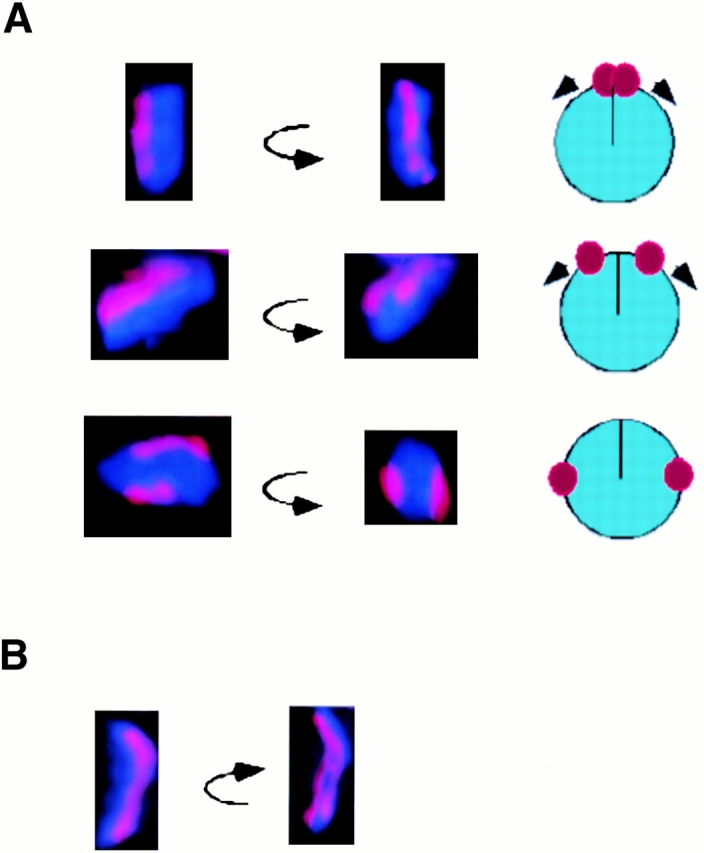

Sister centromere resolution. Individual chromosomes from prophase nuclei were stained with DAPI (blue), α–HCP-1 antibody (not shown), and α–HCP-3 antibody (red). Nuclei containing little or no HCP-1 staining were optically sectioned and a three-dimensional projection generated using the volume viewer function. The resulting images were rotated around the Y-axis. (A) Chromosomes showing different degrees of sister centromere separation. Cartoon of the Z-axis of each chromosome depicting the sister centromeres migration from a juxtaposed position to a maximally resolved orientation is shown adjacent to each image. (B) A single chromosome showing an intermediate “splitting” of sister centromeres. (C and D) Sister centromere resolution is a microtubule-independent process. (C) P1 blastomere from a wild-type embryo stained with DAPI (blue), antitubulin antibody (green), and α–HCP-3 antibody (red). (D) P1 blastomere, from an embryo incubated in the presence of 30 μg/ml nocodazole at room temperature for 30 min, stained as in C. The division time for a two-cell embryo at room temperature is ∼20–30 min, so this embryo had probably just finished cell division when treated with nocodazole. Furthermore, the centrosomes are duplicated (not shown) but have not migrated, indicating that loss of spindle microtubules occurred before centrosome migration, an event that occurs concurrent or before sister centromere resolution (C). Bar, 5 μM.