
Figure 4.
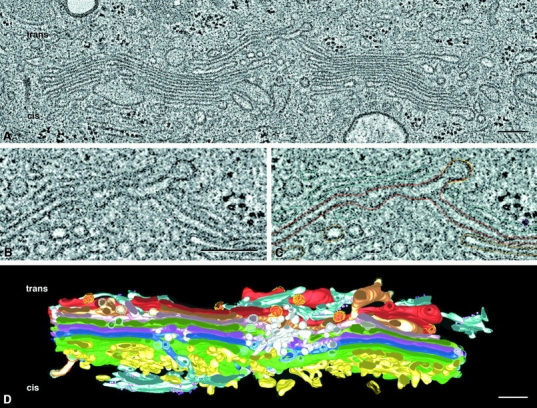
Tomographic reconstruction of a portion of the Golgi ribbon from a cultured normal rat kidney cell, fixed by plunge freezing and freeze substitution (Ladinsky et al. 1999). A shows one tomographic slice ∼4 nm thick from the 257 that comprise the entire reconstruction. The area shown is ∼3.8 × 1.9 μm, and the thickness of the whole tomogram (assembled from four serial 250-nm sections) is ∼1 μm. This volume is large enough that many features of Golgi morphology can be seen with greater clarity and detail than had previously been possible. B shows a small region from A, providing enough magnification to show that the two leaflets of a unit membrane can be resolved (∼6 nm). C shows the same area with graphic objects laid on to mark the positions of membranes in that slice. Similar modeling on every slice, followed by triangulation and surface rendering, permitted the construction of the model shown in D. The trans side of the Golgi apparatus is at the top, the cis at the bottom, and a noncompact region lies at the middle of the reconstruction. For details, see Ladinsky et al. 1999. Reprinted with permission from the authors and the Journal of Cell Biology. Bars, 250 nm.