
Figure 4.
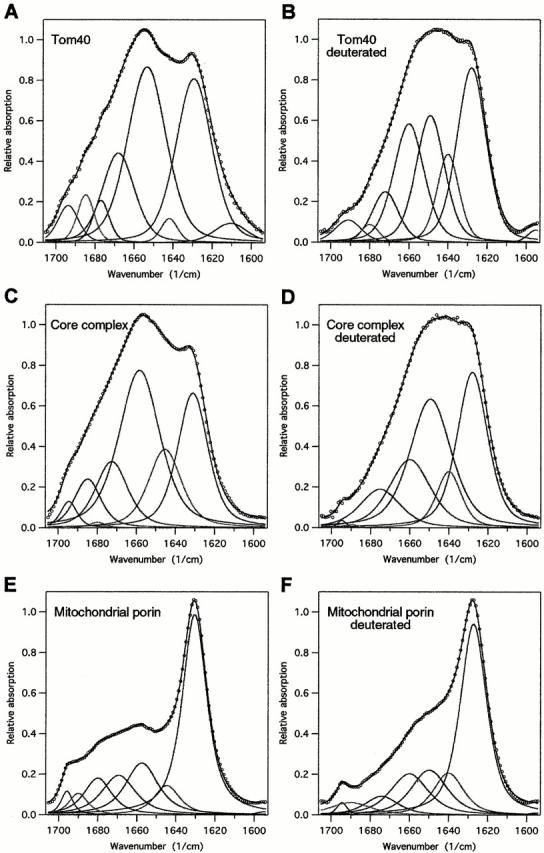
Original and deconvoluted FTIR spectra of Tom40, TOM core complex, and mitochondrial porin. The spectra of Tom40 (A), TOM core complex (C), and porin (E) were recorded on thin films on Ge crystals applying the ATR approach. After the end of measurements, the films were exposed to D2O-saturated nitrogen gas for 120 min, and spectra of deuterated protein were recorded (B, D, and F) in order to separate contributions of α-helix from random coil components. Spectral bands assigned to α-helix structure are centered at ∼1,650 cm−1, random components at 1,645–1,640 cm−1, and β-sheet at 1,630–1,625 cm−1. The shoulder at 1,695 cm−1 indicates antiparallel β-sheet with particularly short turns. For all spectra, the baseline and residual water vapor components were subtracted if necessary.