Figure 3.
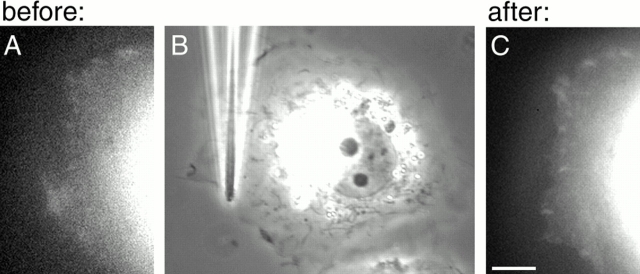
Force-induced focal contact formation as revealed by GFP–paxillin fluorescence. (A and C) GFP–paxillin distribution at the leading edge of serum-starved SV-80 cell 2 min before (A) and 1.5 min after (C) development of the pulling force. (B) Phase image showing the pipette location after the shift. Bar, 10 μm.

