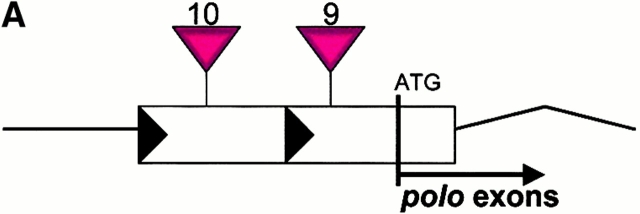
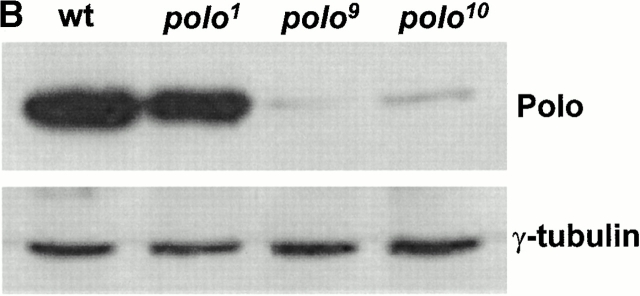
Figure 2.
Sites of P-element insertions in polo 9 and polo 10 and relative expression levels of their gene products. (A) Schematic diagram of insertion sites in which P-elements are indicated by the filled red triangles above the linear map at positions −34 and −176 nucleotides upstream of the initiator ATG codon of the Polo protein. Two major starts for the initiation of transcription are indicated by the horizontal black triangles at positions −130 and −210 nucleotides. Exons are indicated by the open box and the first intron by the kinked line. (B) Western blots to compare the levels of Polo kinase and γ-tubulin in wild-type (wt), polo, polo 9, and polo 10 larval brains (see Materials and Methods).


