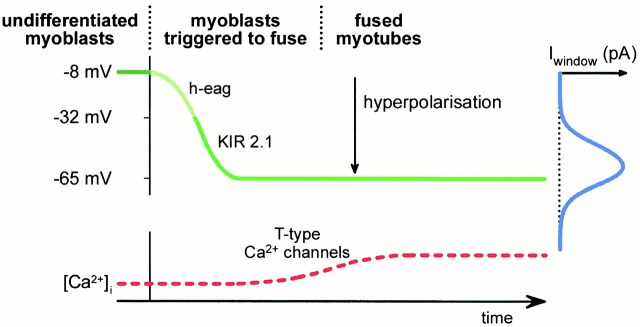
Figure 1.
Model of events leading to an increase in intracellular calcium in fusing myoblasts (adapted from Bijlenga et al. 2000). The green line represents the change in the membrane potential over time. The membrane potential is approximately −8 mV in undifferentiated myoblasts (dark green). When myoblasts are rigged to fuse, they express h-eag, which brings the membrane potential to approximately −30 mV (light green); then the myoblasts express KIR2.1, which brings the membrane potential to approximately −65 mV (green). Shown at the right in blue is the window current for the T-type calcium channels as a function of membrane potential. At approximately −65 mV, the window current is maximum. The bottom curve in red shows the increase in intracellular calcium, which promotes fusion.

