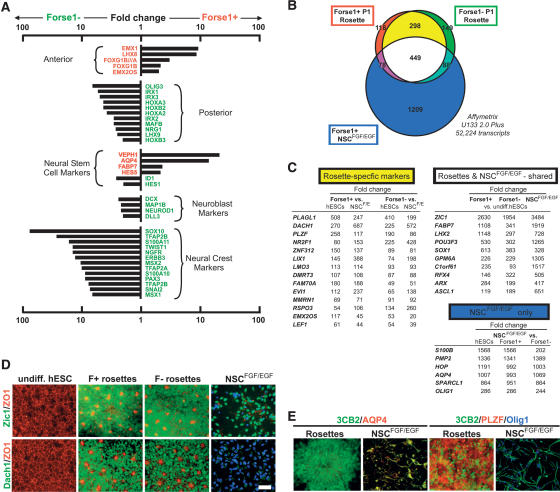
Figure 4.
Genetic characterization of R-NSCs and NSCsFGF2/EGF. (A) Global gene expression analysis (Affymetrix, U133-Plus2) comparing Forse1+ versus Forse1− R-NSCs at P1 (day 25). (B) Venn diagram representing genes specifically expressed in Forse1+ (red) and Forse1− (green) R-NSCs, and in Forse1+ NSCsFGF2/EGF (blue). R-NSC-specific genes are marked in yellow, while genes shared between all three NSC groups are marked in white. (C) Fold changes calculated from Affymetrix analysis for the top differentially expressed transcripts. Fold changes are grouped into those specific for R-NSCs, those shared between R-NSCs and NSCsFGF2/EGF, and those specific to NSCsFGF2/EGF. (D) Immunocytochemical confirmation of representative markers shared between R-NSCs and NSCsFGF2/EGF (Zic1), or markers specific to R-NSC state (Dach1). (E) Colabeling studies of 3CB2 and NSCsFGF2/EGF-specific (AQP4) or R-NSC-specific (PLZF) markers. Bar in D corresponds to 50 μm for all panels.

