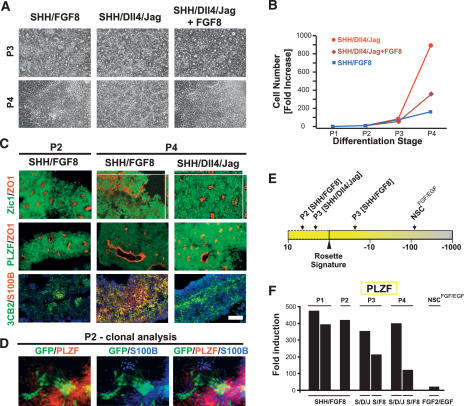
Figure 6.
R-NSC maintenance and transition to NSCsFGF2/EGF stage. Representative phase-contrast images (A) and growth curves (B) over multiple passages in R-NSC cultures maintained with candidate growth factor regimens. (C) Corresponding immunocytochemical analyses for rosette structure (Zic1/ZO-1), markers of R-NSCs (PLZF), NSCsFGF2/EGF (S100B), and radial glia (3CB2). (D) Clonal analysis of constitutively eGFP-expressing R-NSCs sorted for Forse1. Cells are shown at the transition toward NSCsFGF/EGF with partial loss of PLZF expression and loss of epithelial organization in a subset of clonally derived eGFP+ cells. (E) Effect of passage and growth regimen on “rosette score,” a composite measure for gene expression for all 298 R-NSC markers. (F) qRT–PCR analysis for PLZF expression over passage in SHH/Dll4/Jag- versus SHH/FGF8-treated R-NSCs. Bar in C corresponds to 50 μm in A and C.

