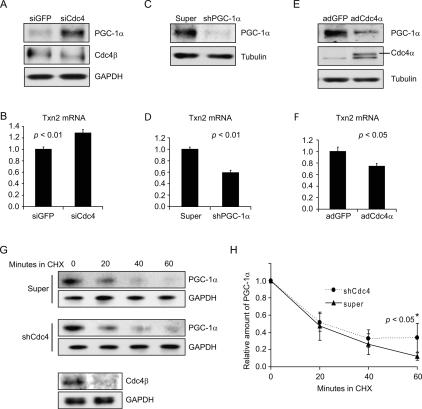
Figure 6.
PGC-1α levels are regulated by SCFCdc4-dependent ubiquitin-mediated proteolysis in primary embryonic mouse brain neurons. (A,B) siRNA-mediated silencing of Cdc4 in primary neurons leads to an increase in PGC-1α levels and an increase in Txn2 transcription. Primary neurons were transfected twice with control (GFP-specific) or Cdc4-specific siRNAs at 24-h intervals and then neurons were harvested 24 h later. (A) PGC-1α and Cdc4 protein levels determined by Western blotting. (B) Txn2 transcript levels were determined by real-time PCR. (C,D) shRNA-mediated silencing of PGC-1α in primary neurons leads to a decrease in transcription of the antioxidant defense gene TXN2. Either control or recombinant adenovirus expressing PGC-1α-specific shRNA was transduced into primary embryonic mouse brain neurons, which were then harvested 24 h later. (C) PGC-1α protein levels were determined by Western blotting. (D) Txn2 transcript levels were determined by real-time PCR. (E,F) Increased expression of Cdc4α in primary neurons leads to a reduction in PGC-1α levels and Txn2 transcription. Primary neurons were transduced with adenoviruses expressing GFP or Cdc4α and then harvested 24 h later. (E) PGC-1α and Cdc4 protein levels were determined by Western blotting. (F) Txn2 transcript levels were determined by real-time PCR. (G,H) Reduction of Cdc4 levels by shRNA-mediated gene silencing decreases the rate of PGC-1α turnover. Primary neurons were transduced with control (super) or Cdc4 shRNA adenovirus and then 24 h later a cycloheximide chase experiment was performed. Time 0 corresponds to the time of cycloheximde addition. Neurons were harvested at the indicated times after cycloheximide addition. (G) PGC-1α and GAPDH (loading control) levels were determined by Western blotting. Cdc4β levels were determined for time 0 to confirm effective Cdc4 silencing. (H) Quantitation of PGC-1α levels normalized to GAPDH in three cycloheximide chase experiments, including the one shown in G. Error bars correspond to one standard deviation. The difference between the decay curves achieves statistical significance (P < 0.05, Student’s t-test) at the 60-min time point, although a trend is observable at all time points. (B,D,F) For Txn2 mRNA level determinations, values given are normalized to 36B4 mRNA levels. Error bars represent the standard error from three experiments. P values given are based on Student’s t-test.

