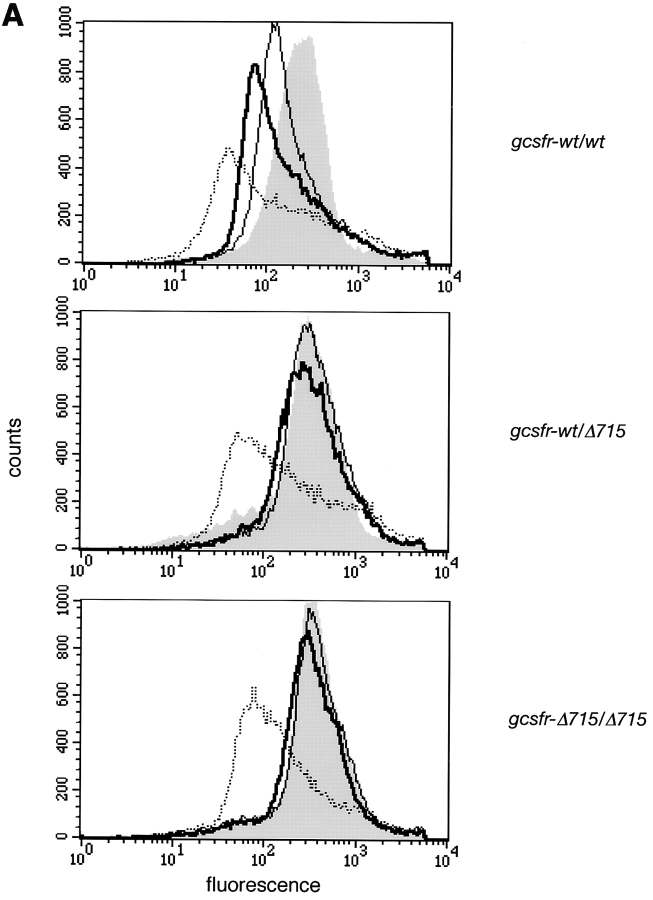
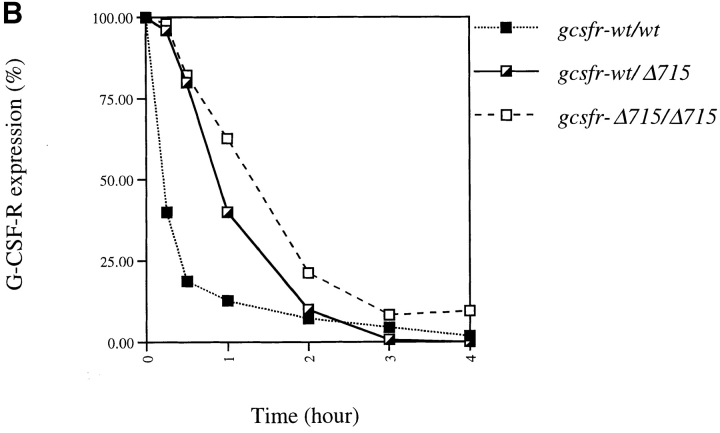
Figure 6.
Comparison of internalization kinetics of full-length and truncated G-CSF–R. BM cells were incubated with biotinylated G-CSF at 37°C for the indicated periods and then stained with SA-PE. (A) Shaded histogram, t = 0; solid line, t = 15 min; bold line, t = 30 min; dotted line, t = 4 h. (B) Peak fluorescence standardized for t = 0 as a function of time.


