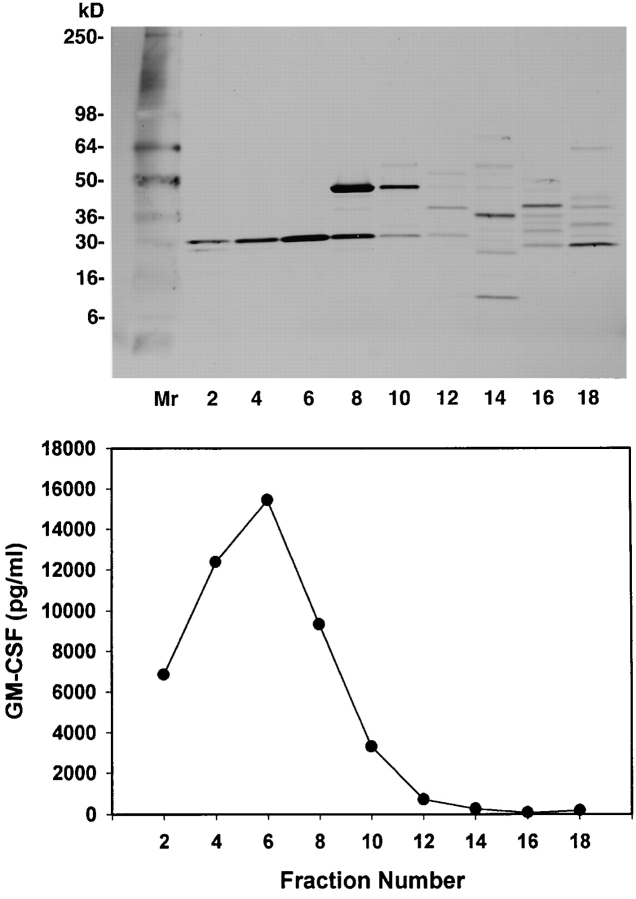
Figure 4.
Purification of the 1558-mel Ag by hydrophobic interaction chromatography. Individual eluate fractions (5 × 10⁷ cell equivalents/ well) were pulsed onto APCs for T cell recognition. SDS-PAGE (silver stain) shows that bioactive fractions 4 and 6 appear to contain a single protein band of ∼30 kD. The protein in fraction 6 was sequenced via mass spectrometric analysis, identifying it as TPI. This was confirmed by NH2-terminal Edman degradation sequencing of fraction 4.

