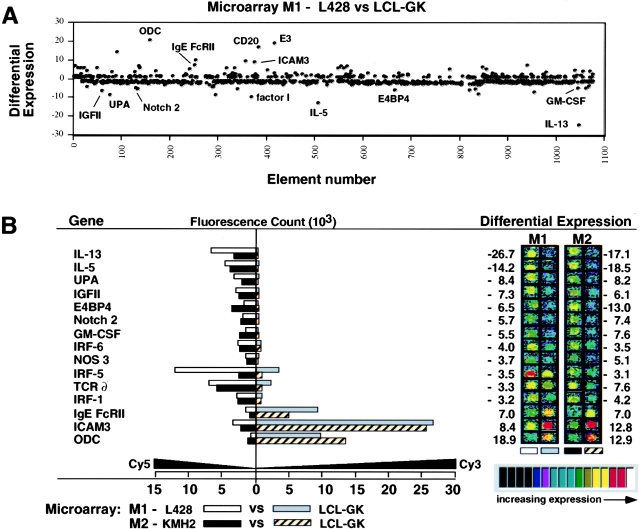
Figure 1.
Differential expression of 950 genes investigated by microarray hybridization. (A) Genes showing the greatest differential expression are indicated. The vertical axis shows differential expression calculated as the ratio of the values of the two channels recording Fluorescence1 signal (Cy3) and Fluorescence2 signal (Cy5). A positive number indicates that Cy3 (channel one) is greater than Cy5 (channel two), whereas a negative number indicates that Cy5 is greater than Cy3. (B) Genes showing differences in expression that were greater than threefold on two microarrays (M1, M2). Fluorescent scans are represented in pseudocolor and correspond to hybridization intensities of genes. False colors ranging from black (at the low end) through blue, green, yellow, and red to white (at the high end) indicate the intensity of the signal. E3, retinoic acid-inducible E3 protein; IGFII, insulin-like growth factor II; IRF, interferon regulatory factor; NOS 3, nitric oxide synthase 3; ODC, ornithine decarboxylase; UPA, urokinase plasminogen activator.

