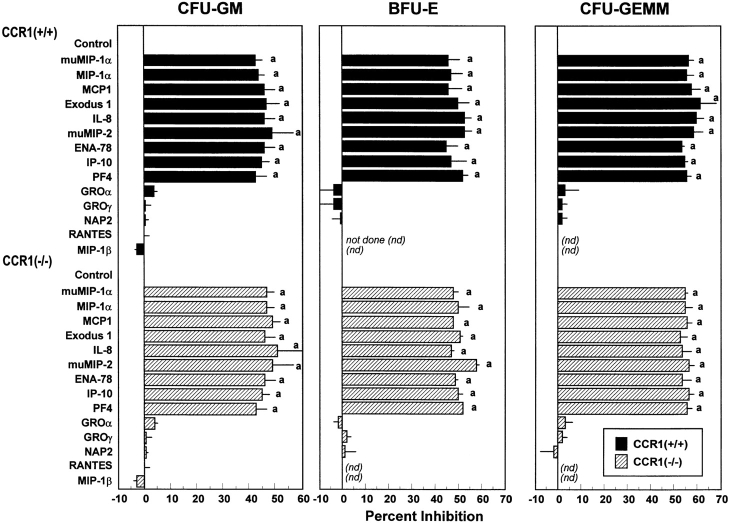
Figure 2.
Influence of chemokines on colony formation of CFU-GM, BFU-E, and CFU-GEMM from bone marrow of CCR1+/+ compared with CCR1−/− mice. All chemokines are human unless designated as murine (mu). Results shown are percent inhibition ± 1 SEM for two to seven separate experiments, each using cells pooled from two to four mice. Results for mu and huMIP-1α are from seven (CFU-GM), three (BFU-E), and three (CFU-GEMM) experiments. Other results for CFU-GM are from two to five experiments and for BFU-E and CFU-GM from two experiments. Control colony numbers for CCR1+/+ and CCR1−/− cells, respectively, ranged from 55 to 152 and 63 to 145 for CFU-GM, from 18 to 25 and 20 to 24 for BFU-E, and from 11 to 15 and 12 to 15 for CFU-GEMM. a P < 0.001, statistically significant change from control diluent of a particular subset of MPCs in either CCR1+/+ or CCR1−/− mice.

