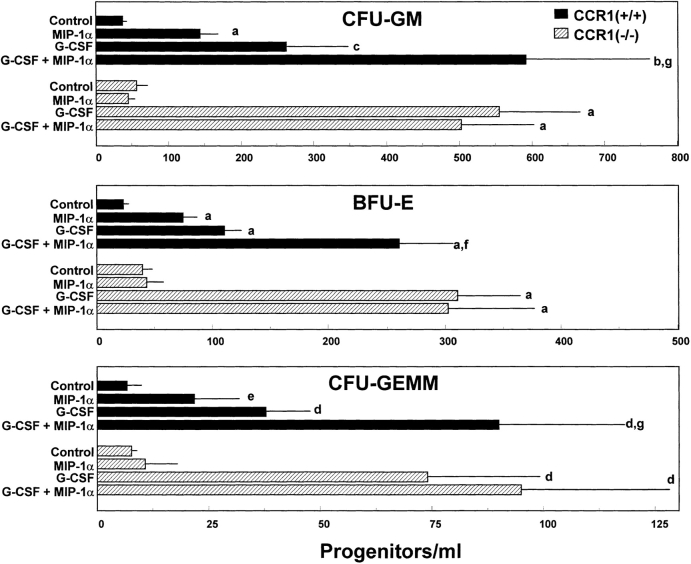
Figure 3.
Mobilization of CFU-GM, BFU-E, and CFU-GEMM in CCR1+/+ compared with CCR1−/− mice after administration of G-CSF, huMIP-1α, or G-CSF plus huMIP-1α. Results are the average of eight to nine mice, each individually evaluated, from a total of two complete experiments. Significant change from control: a P < 0.001; b P < 0.003; c P < 0.005; d P < 0.01; e P < 0.05. Significant change from G-CSF group: f P < 0.008; g P < 0.05.

