Figure 1.

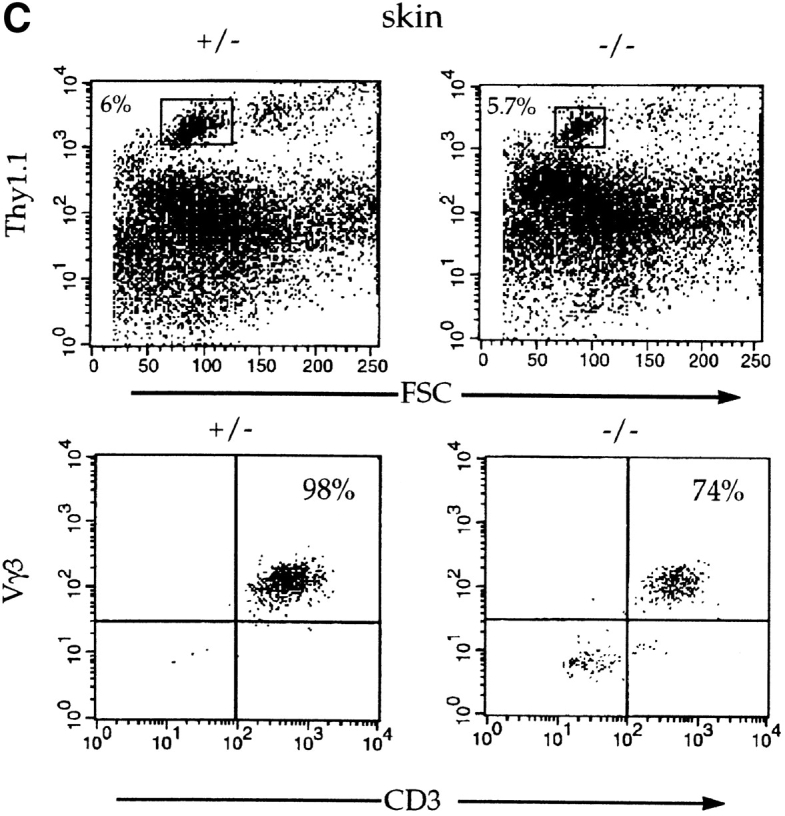
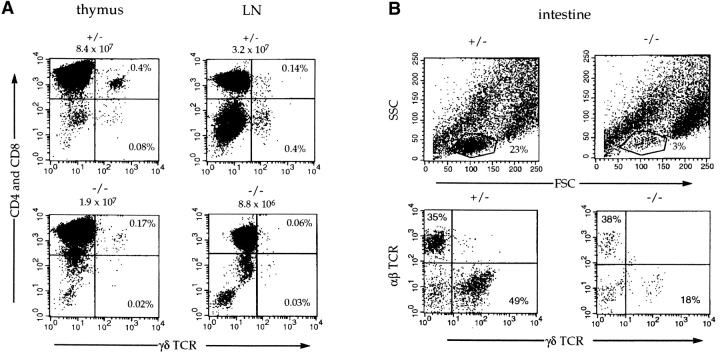
Flow cytometric analysis of γ/δ T cell populations in E2A-deficient mice. Flow cytometric analysis of thymus and lymph node (LN) cells from a 6-wk-old E2A-deficient mouse and a heterozygous littermate (A). Cells were stained with anti-CD4PE, anti-CD8PE, and anti–γ/δ TCRFITC. The number shown above each FACS® profile represents the total number of cells isolated from that tissue. The percentages of γ/δ cells are indicated. The total number of γ/δ cells is decreased 10–20-fold in the thymus and lymph nodes of E2A-deficient mice. (B) Intestinal T cells from an E2A-deficient mouse and a heterozygous littermate were stained with anti–α/β TCRcy-chrome and anti–γ/δ TCRbiotin (streptavidin-PE). The total number of intestinal lymphocytes (top) is decreased approximately sevenfold in the E2A-deficient mice (3 vs. 23%). Bottom panels show the α/β versus γ/δ staining of the lymphocytes gated in the top panels with the percentages of each population indicated. (C) Cells isolated from the skin of an E2A-deficient mouse and a heterozygous littermate were stained with anti-Thy1.1biotin (streptavidin–Red 670), anti-CD3PE, and anti-Vγ3FITC. T cells were gated on the basis of forward scatter and Thy1.1 expression (top), and the gated cells were analyzed for the expression of CD3 and Vγ3 (bottom).

