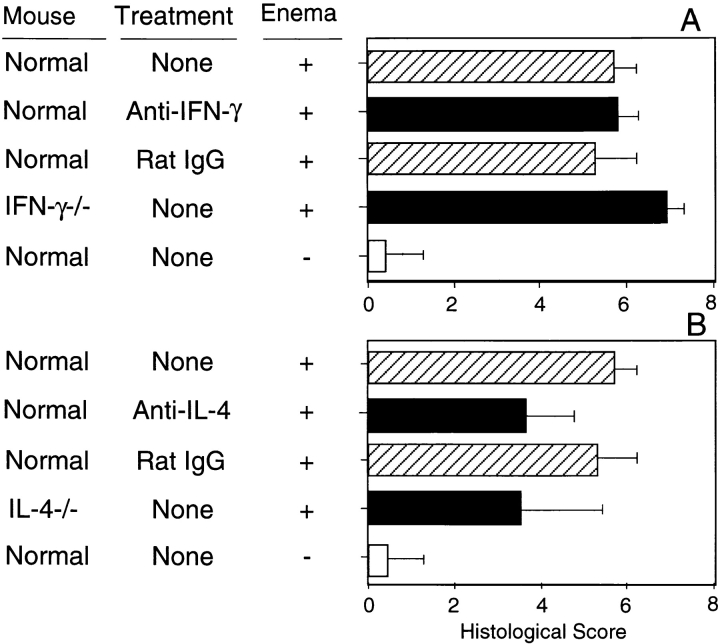
Figure 7.
Histological scores for Th1 and Th2 cytokine-deficient mice with TNBS colitis. (A) IFN-γ–deficient mice; (B) IL-4–deficient mice. Each group included 4–10 mice. Values are shown as the average ± 1 SD. The score of IFN-γ−/− mice was significantly higher than that of other groups in A (P < 0.02). IL-4−/− mice and mice treated with anti–IL-4 mAb showed significantly lower values than did normal BALB/c and IFN-γ−/− mice (P < 0.05). −, rectal administration of ethanol only.

