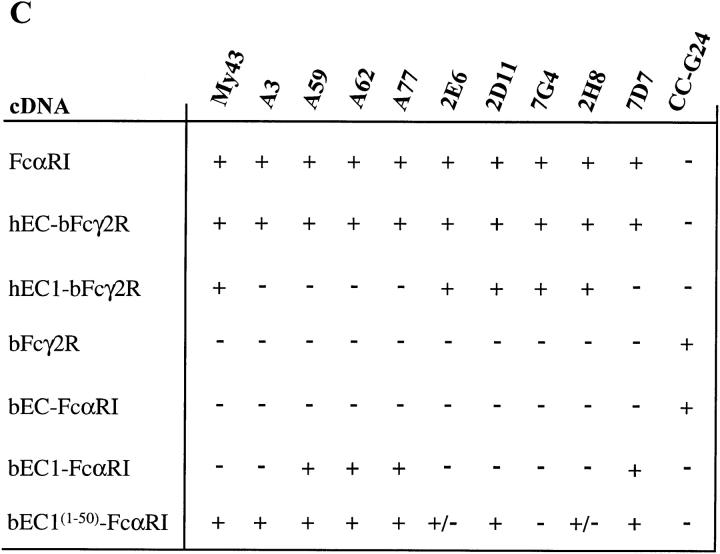
Figure 5.
(A) FACS® analysis of newly produced mAbs to FcαRI compared with mAb A77 of similar specificity. FcαRI-expressing murine B cells (IIA1.6) were incubated with mAbs as indicated (white peaks) or with concentration and isotype-matched control mAbs (hatched peaks), followed by a GAM IgG1–PE conjugate. (B) FcαRI-expressing IIA1.6 cells were incubated without (left panel) or with mAbs as indicated, followed by heat-aggregated hIgA (aIgA). After 1 h at 4°C, cells were washed and bound hIgA was detected by incubation with goat anti–human IgA F(ab)2-PE conjugate (white peaks). Cells incubated with only the secondary reagent served as negative controls (hatched peaks). (C) Reactivity of chimeras (left) with a panel of FcαR and bFcγ2R mAb (top) as measured by FACS® analysis. Binding was graded as follows: +, strong binding; +/−, weak binding; −, no binding.


