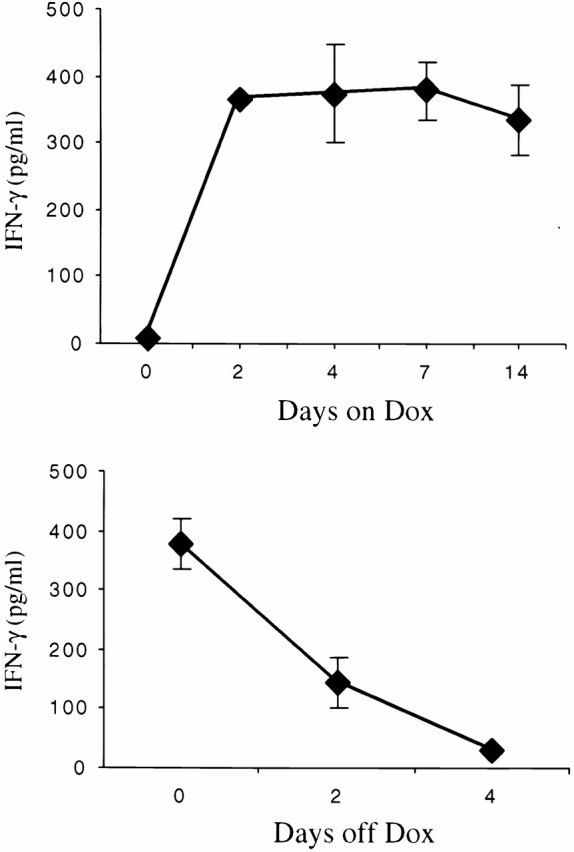
Figure 3.

Kinetics of dox regulation of IFN-γ in CC10-rtTA-IFN-γ mice. The kinetics of dox induction of IFN-γ are illustrated in the top panel. In these experiments, BAL was performed on 1-mo-old dual transgene-positive animals (0 d) and identical animals after the noted intervals of dox water exposure. In the bottom panel, the kinetics of IFN-γ elimination are illustrated. In these experiments, 1-mo-old dual transgene-positive animals were placed on dox for 1 wk and then placed back on normal water. The levels of BAL IFN-γ were evaluated at the time the animals went from normal water to dox water (time 0) and at intervals thereafter. The noted values represent the means ± SEM of a minimum of four animals at each time point.
