
Figure 7.
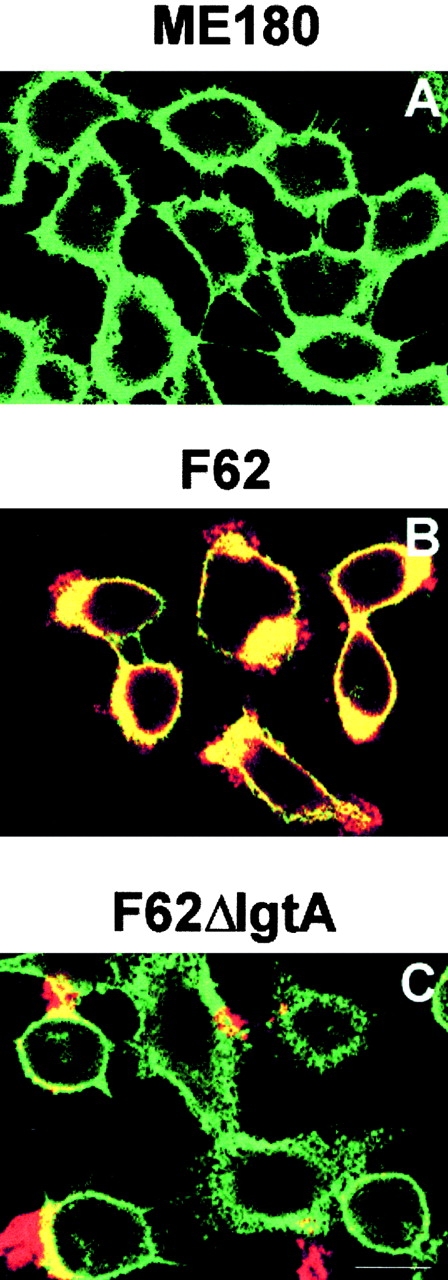

The rearrangement of actin filaments in ME180 induced by gonococci. ME180 cells, grown on coverslips, were incubated with 107 CFU/ml of gonococci at 37°C for 3 h. After washing, fixation, and permeabilization, gonococci were visualized with pilin-specific mAb and a rhodamine-conjugated goat anti–mouse IgG antibody (red). Actin filaments were stained with FITC-labeled phalloidin (green). The cells were analyzed using a confocal fluorescence microscope. The images were taken from the optical sections where epithelial cell–associated gonococci were visible. Shown are the representative images: (A) untreated cells; (B) cells inoculated with the F62; (C) cells inoculated with F62ΔlgtA. (D) The quantitative analysis of images randomly taken from the epithelial cells inoculated by gonococci. For each strain of gonococci, >10 images from 2 or 3 independent experiments were analyzed. White bars represent the cells where almost of all visible actin filaments were accumulated under gonococcal adherent sites. The colocalization of actin filaments and gonococci are shown as yellow. Black bars represent the cells where only a small amount of actin filaments was rearranged. Gray bars represent the cells where the rearrangement of actin filaments was not detected. These data were plotted as the percentage of total number of epithelial cells associated with gonococci. Bar, 12 μm.