
Figure 2.
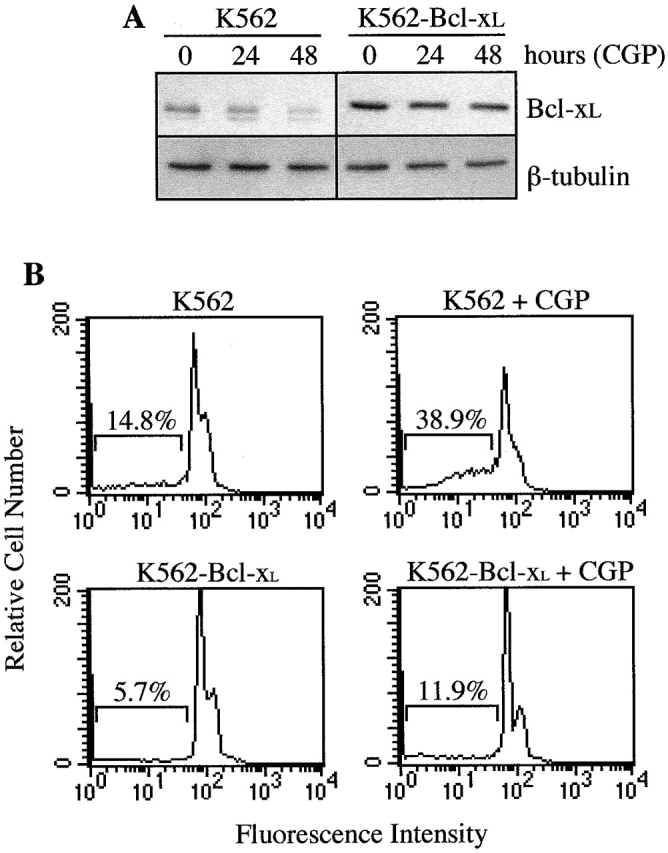
Analysis of Bcl-xL and apoptosis in K562 and K562–Bcl-xL cell lines. (A) Cells were treated for different times with CGP 57148 and analyzed for the expression of Bcl-xL by Western blot. The levels of β-tubulin were also analyzed to assure equal loading. (B) Apoptosis of cells treated with the kinase inhibitor was quantified by cell cycle analysis. Numbers represent the percentage of cells with subdiploid DNA content. Histograms are from a representative experiment (n = 3).