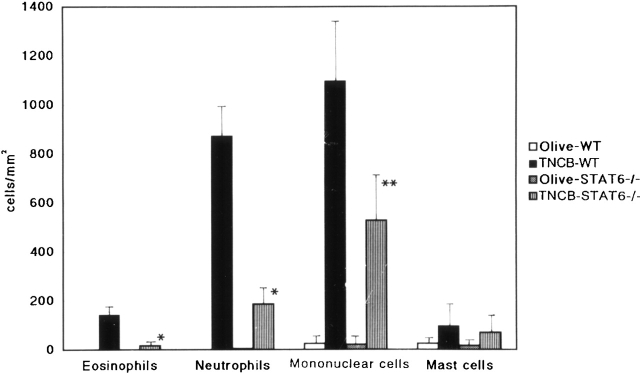
Figure 5.
Effect of STAT6 deficiency on the cellular distribution of challenged skin. Challenged skin was obtained from wt (WT) and STAT6−/− mice after challenge with the application of 1% TNCB or olive oil. Bars represent the number of eosinophils, neutrophils, monocytes/macrophages, and mast cells that infiltrated the challenged skin. The results shown are from a single experiment representative of three separate experiments. *P < 0.01 vs. TNCB-challenged wt mice. **P < 0.05 vs. TNCB-challenged wt mice.

