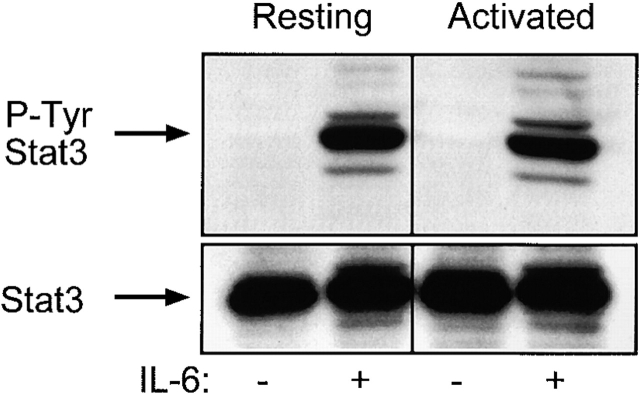
Figure 6.
IL-6 induced phosphorylation of Stat3 at Tyr705 in both activated and resting T cells. T cells from C57BL/10 LNs were sorted into resting (Vβ4,6,11,14) and activated (Vβ8) as described in Materials and Methods. Cells were treated with 10 ng/ml IL-6 or medium alone for 20 min and lysed. Each lane contains 2.5 × 10⁶ cell equivalents. The top panels show the anti–phospho-Stat3 (Tyr705) blot (P-Tyr Stat3). The bottom panels show the total Stat3 in each lane after stripping and reprobing. This is one of three experiments with similar results.

