
Figure 1.
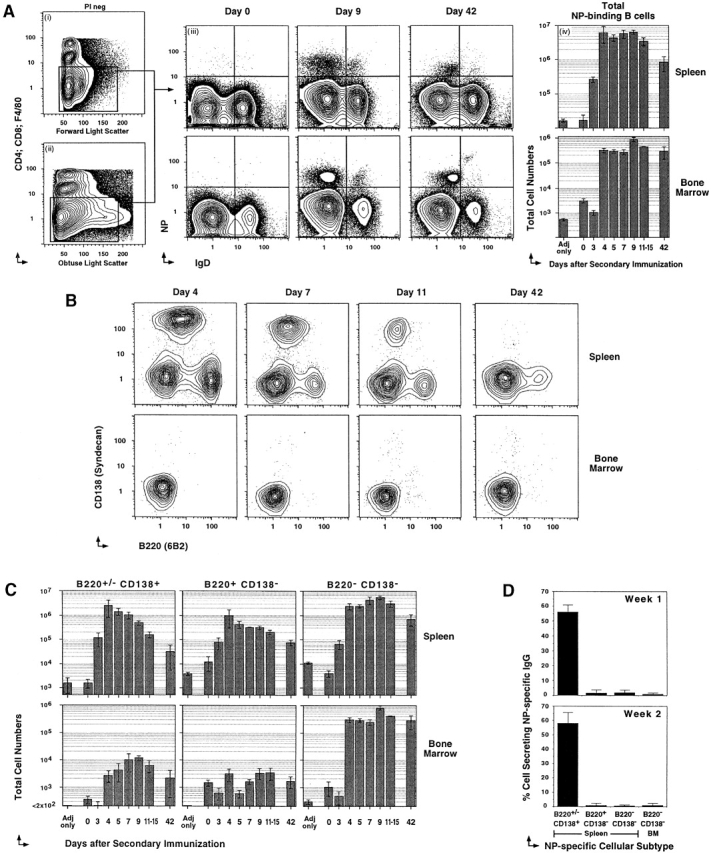
Three major subsets of NP-specific memory B cells. Previously primed C57BL/6 mice, rechallenged with 400 μg NP-KLH in Ribi adjuvant, were killed at various times after recall to label spleen and bone marrow cells for five-color flow cytometry. (A, i and ii) PI labeling is excluded at time of acquisition. One example of light scatter parameters and Cy5PE labeling (anti-CD4, anti-CD8, and anti-F4/80) used to exclude T cells, macrophage, and cells that nonspecifically label with Abs. Light scatter gates are broad to include B cell blasts. (A iii) Examples of IgD (Texas red 11.26) and NP (NP-APC) labeling on the Cy5PE− cells. Days after recall are displayed above each pair of panels. The top panels are spleen, and the lower are bone marrow. Each upper left quadrant delineates fluorescence intensities of cells regarded as NP+IgD−. (A iv) Cellular dynamics of the total NP-binding B cell compartment. Frequencies of NP-binding IgD− B cells obtained by flow cytometry, and total cell numbers from the spleen (top) and bone marrow (bottom) of each animal at the time of killing were used to estimate the change in total NP-binding cells during the course of the recall response. Varying numbers of single animals were used for each time point (n = 3–7), with mean ± SEM of total cells displayed. (B) Examples of CD138 (PE-281.2) and B220 (FITC–RA3-6B2) levels on NP-specific B cells (CD4−CD8−F4/80−IgD−NP+) of the spleen (top) and bone marrow (bottom). The day after Ag administration is displayed above each panel. (C) Cellular dynamics of the three NP-binding B cell subsets, with the phenotype displayed above each panel for the spleen (top) and bone marrow (bottom). Mean ± SEM of total cells is displayed across time after recall (n = 3–7 for each time point). (D) CD4,− CD8,− and F4/80− NP+IgD− B cells with the phenotype B220+/−CD138+, B220+CD138−, and B220−CD138− B cells from the spleen and bone marrow (BM) of the secondary response were sorted at 50 cells per well into NP-specific IgG-revealing ELISPOT assays. Positives were scored manually under a dissection microscope. Each assay was done in triplicate from at least three separate animals.