
Figure 2.
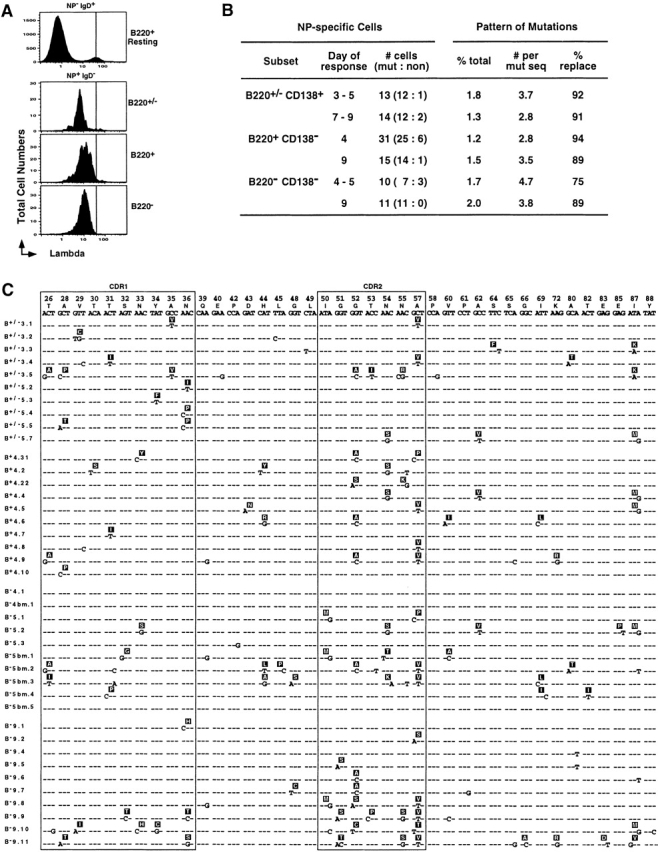
All three NP-specific subsets express somatically mutated Vλ1 L chains. (A) Representative histograms of λ1 L chain expression (FITC-JC5) on CD4−, CD8−, and F4/80− cells that were also NP−IgD+B220+ (first panel), NP+IgD−B220+/− (second panel), NP+IgD−B220+ (third panel), and NP+ IgD−B220− (fourth panel). (B) A summary of the extent and pattern of somatic hypermutation in the λ1 L chain expressed by the three major subsets of NP-specific B cells (PI−CD4− CD8−F4/80−NP+IgD−). Single NP-specific B cells from each of the three subpopulations of cells (as defined in the legend to Fig. 1) at different time points of the recall response were sorted into cDNA reaction mix, subjected to two separate rounds of PCR for λ L chain and PCR products, sequenced as described in Materials and Methods. Day of response refers to time after rechallenge; # cells refers to the number of λ L chains sequenced from individual cells and the proportion that were mutated versus nonmutated; % total represents the percentage of the total base pairs sequenced that were mutated (reliable sequence from position 26–88 for all samples), with the average number of mutations per mutated sequence summarized in the next column; and the % replacement mutations in the CDR1 and 2 are presented in the final column. (C) A representative set of Vλ gene nucleotide and predicted amino acid sequence obtained from individual NP-specific B cells. Only the nucleotides differing from the germline V-J sequence are presented: dashes represent identity; CDR 1 and 2 are boxed. The cells are grouped into four categories, with each representing sequence from individual cells with the phenotype of the following: the upper panel is NP+IgD− B220+/−CD138+ B cells (labeled B+/−) from days 3 and 5; the second panel is NP+IgD−B220+CD138− B cells (B+) from day 4; the third panel is NP+IgD−B220−CD138− B cells (B−) from the spleen or bone marrow (bm) from day 4 and 5; and the bottom panel is NP+IgD−B220−CD138− B cells (B−) from day 9 spleen.