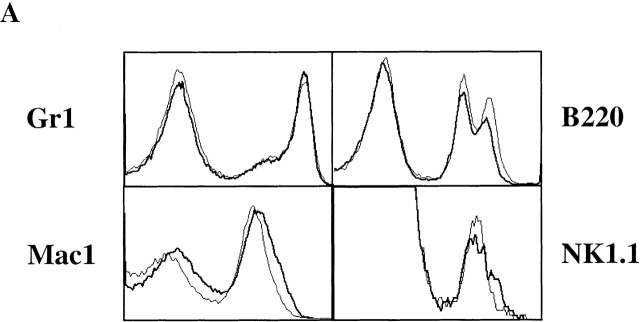
Figure 6.
The development of granulocytes, macrophages, B cells, and NK cells is Notch1 independent. (A) Chimeric BM was analyzed for the presence of granulocytes, macrophages, and B cells by staining with mAbs specific for Gr1, Mac-1, and B220. Chimeric spleens were analyzed for the presence of NK cells by staining NK1.1 gated on CD3− cells. The histograms show the expression pattern of these markers in the CD45.2+ cells derived from either control (thin line) or induced Notch1−/− (bold line) BM cells. (B) Absolute cell numbers (×106) for Mac-1+, Gr1+, B220+, and NK1.1+(CD3−) cells in the CD45.2+ fraction derived from either control or induced Notch1−/− BM cells are calculated and shown as bar diagrams. The bars represent average values, and the triangles represent values from individual mice (n = 8 for both control and induced Notch1−/− chimeric mice).


