
Figure 7.
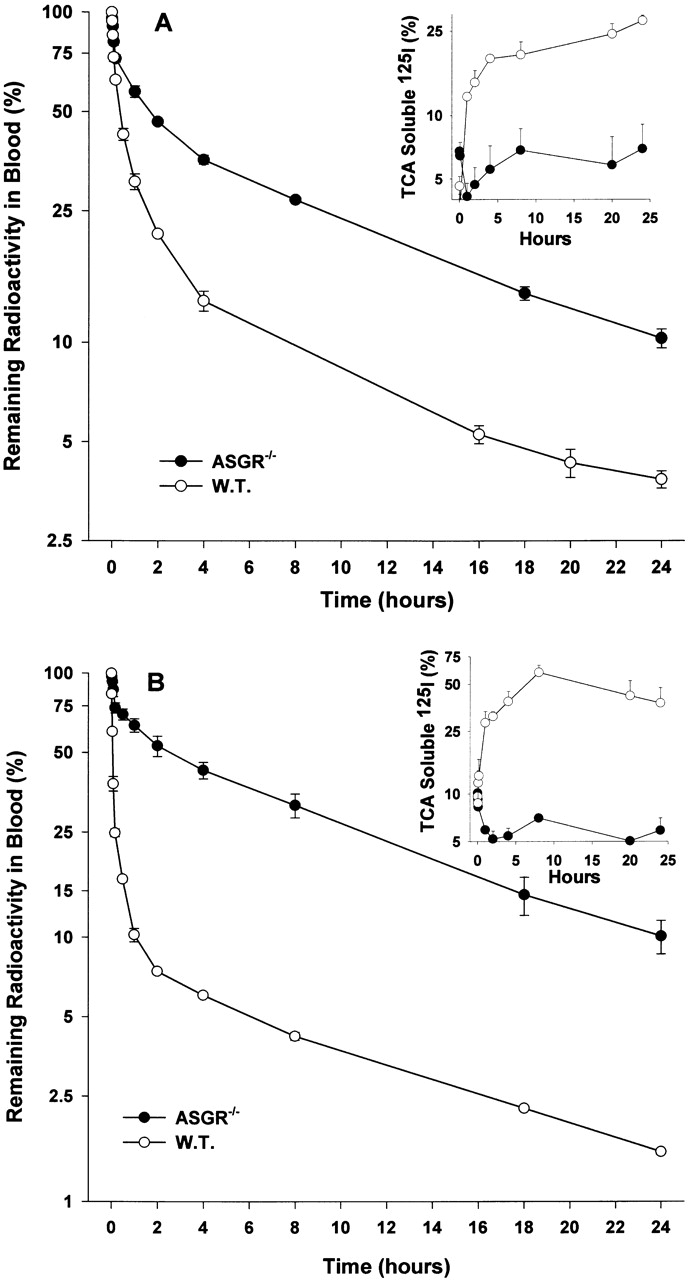
Comparison of kinetics of serum clearance of IgA2m(1) and IgA2m(2) in C57BL/6 (W.T.) and ASGR−/− knockout mice. Radiolabeled IgA2m(1) (A) or IgA2m(2) (B) was injected into the tail vein of C57BL/6 or ASGR−/− knockout mice. At the indicated time points, the IgA remaining in the blood was determined as described in the legend to Fig. 3. The amount of TCA-soluble material present in the blood at the different times is shown in the insert. Each data point represents the mean ± SD of three mice.