
Figure 2.
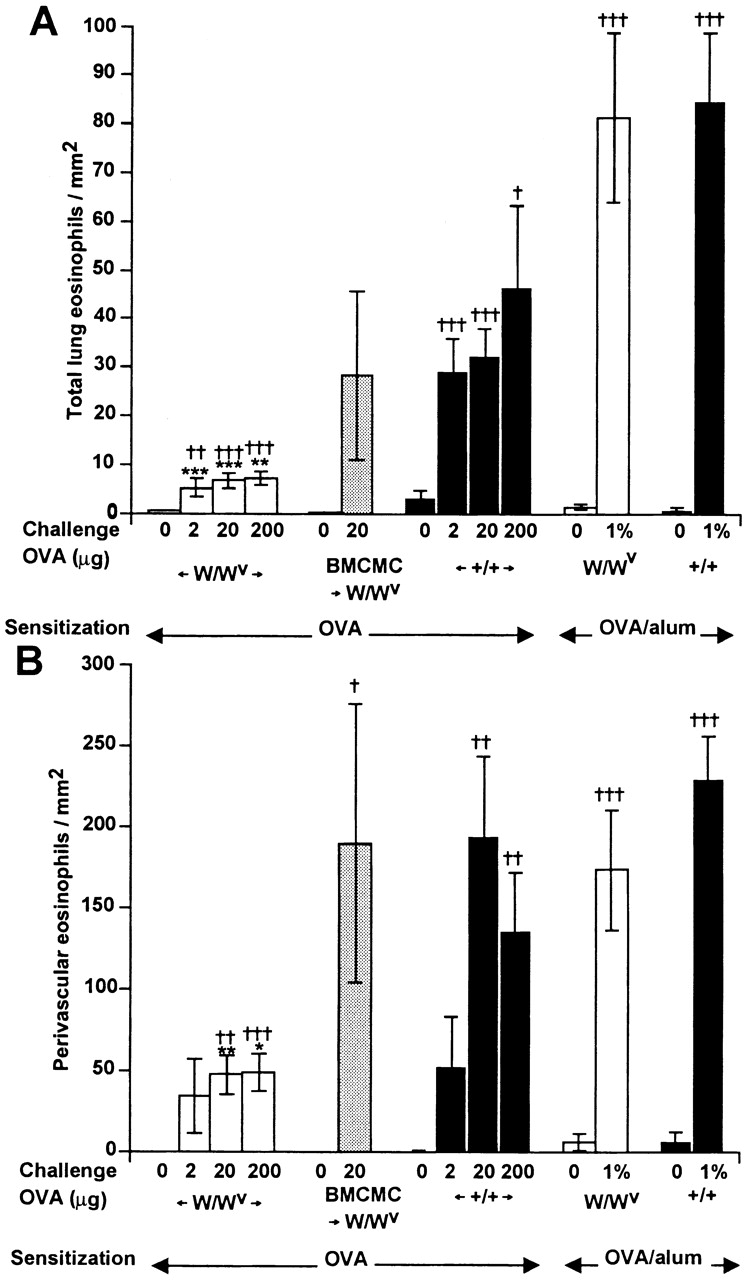
Lung tissue eosinophil infiltration. (A) Total numbers of eosinophils/mm2 of lung tissue. (B) Eosinophils/mm2 of perivascular tissue. Statistical significance was determined using the unpaired Student's t test (two tailed). *P < 0.05, ** P < 0.01, and *** P < 0.001 versus values for identically treated WBB6F1-+/+ mice; † P < 0.05, †† P < 0.01, and ††† P < 0.001 versus values for identically sensitized but saline-challenged mice (shown as mice challenged with “0” OVA) of the same genotype. Numbers of mice per group: n = 10 for BMCMC →W/Wv and n = 10 for W/Wvor +/+ in the OVA/alum groups, and n = 24–32 for W/Wv or +/+ in the OVA groups.