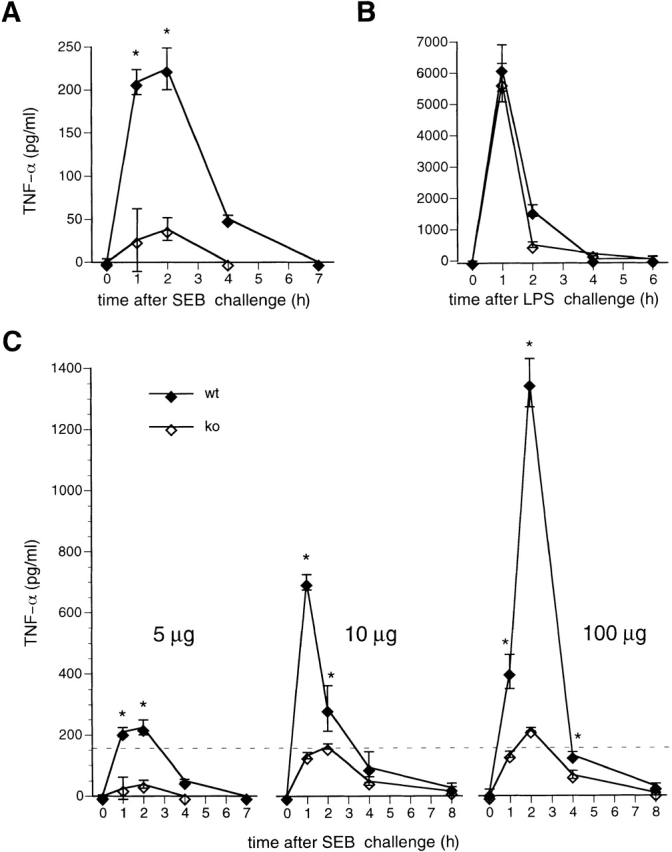
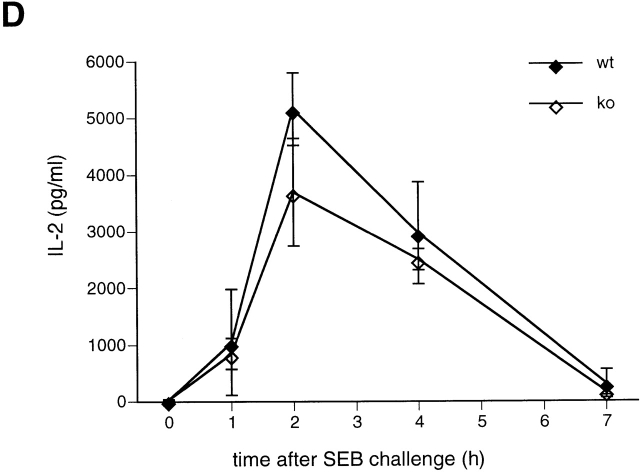
Figure 2.
TNF-α protein levels are reduced in NFATp−/− mice after SEB but not after LPS injection. At each time point after injection with SEB (A, C, D) or LPS (B) two NFATp+/+ (♦) and two NFATp−/− (⋄) mice were killed and serum TNF-α (A, B, C) or IL-2 (D) levels were evaluated by ELISA. The error bars represent standard deviation. *P < 0.02 for protein levels in NFATp−/− mice versus their NFATp+/+ littermates.


