
Figure 3.
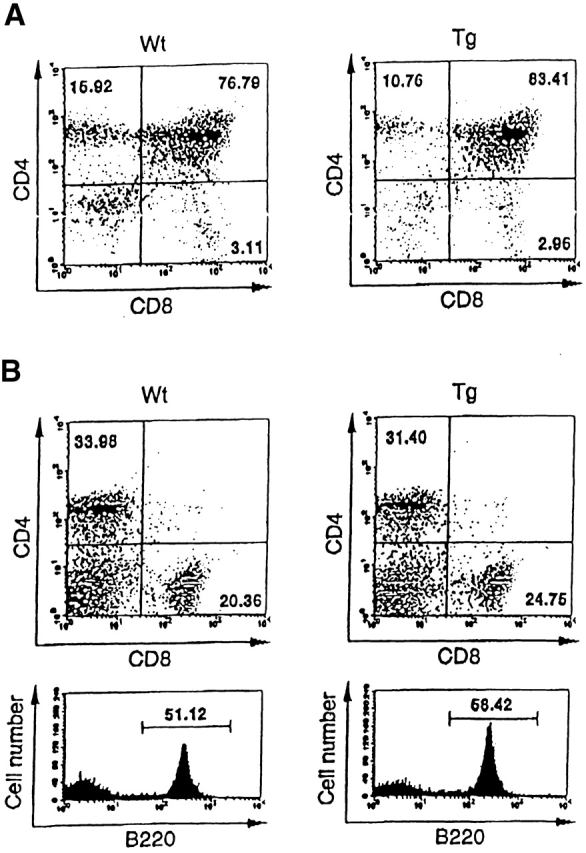
Normal T cell and B cell development in Smad7 Tg mice. FACS® analysis of thymocytes (A) or splenocytes (B) using the indicated conjugated antibodies. All data were gated for viable cells. Percentages represent proportions of viable cells in each region or quadrant. The results are from one representative experiment out of three.