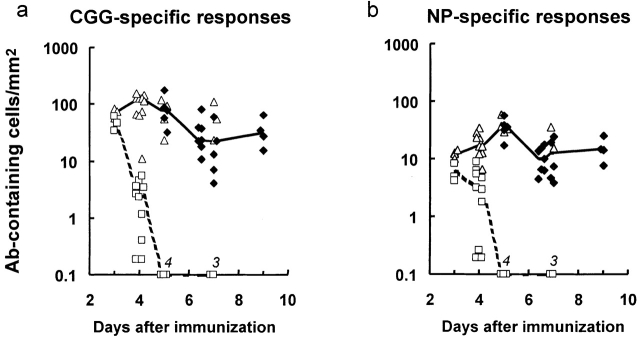
Figure 3.
The peak number, proliferation, and decline of red pulp antigen-specific antibody-containing cells in mice primed with CGG and reimmunized with NP-CGG. (a) The total number of CGG-binding plasmablasts and plasma cells/mm2 of red pulp in individual mice (♦ and ▵, respectively); medians are joined by a solid line. The number of CGG-binding cells that had taken up BrdU in the 2 h before the spleen was taken are shown (□); medians are joined by a dashed line (the BrdU labeling data were obtained from the mice whose total CGG-specific antibody-containing cell counts are shown [▵]). (b) Equivalent results for NP-binding plasmablasts and plasma cells in the same mice studied in panel a. Numbers on x-axis in italics indicate observations with values below the scale.

