Figure 2.


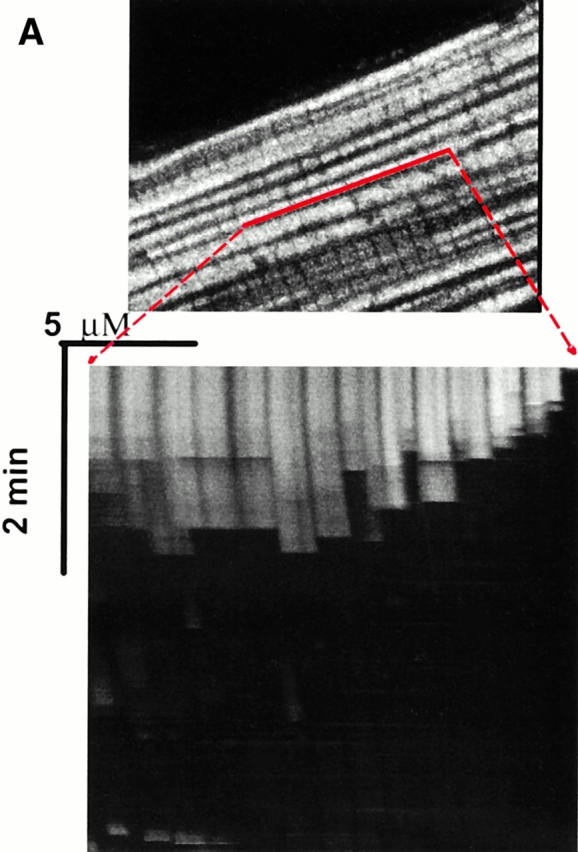
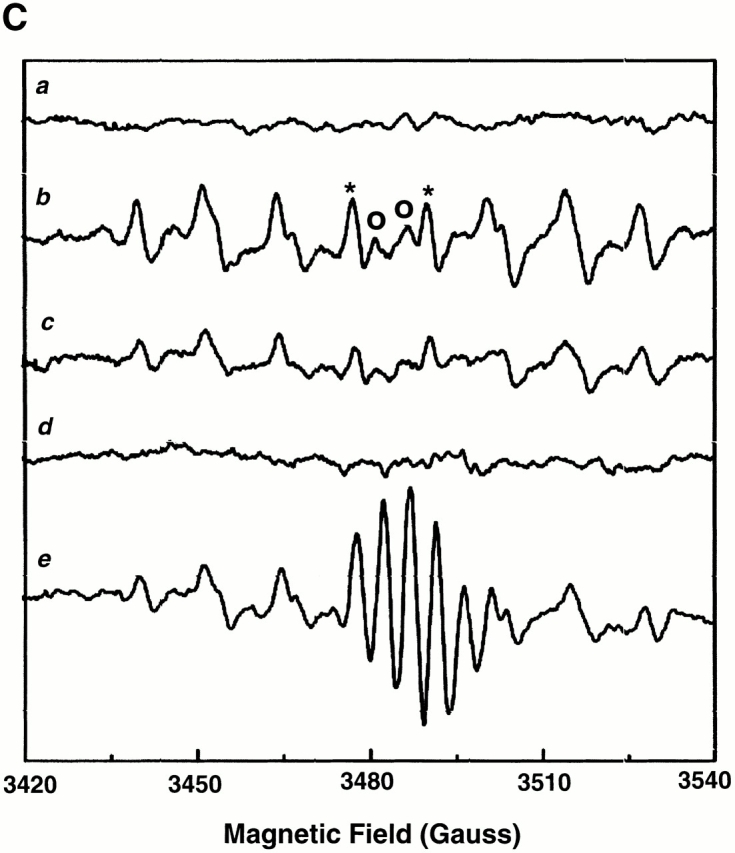
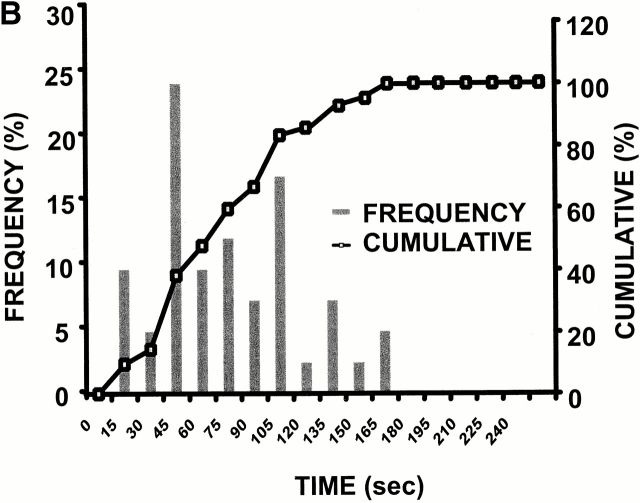
Experimental model: line scanning of mitochondrial arrays and photoexcitation ROS production. (A) Upper panel, confocal image of fluorescence in TMRM-loaded (125 nM) cardiac myocyte. Line drawn on image shows position scanned for experiment in bottom panel. Bottom panel shows 2 Hz line-scan image of TMRM fluorescence along mitochondrial row; time progresses from top (total scan 256 s). The dark regions between vertical columns are junctions between mitochondria. The sudden dissipation of TMRM fluorescence (white-to-black transitions) indicates mitochondrial ΔΨ loss. (B) Frequency distribution of ΔΨ transition times (time to 50% dissipation of ΔΨ) for the mitochondrial ensemble during line-scan imaging at 2 Hz as in A (n = 5 cells). (C) EPR spin-trapping, measured as the formation of DEPMPO/·OH and ·O2 − adducts during photoactivation of TMRM solutions. The system consisted of TMRM (100 μM) and DEPMPO (10 mM) in Hepes-buffered medium, pH 7.4, maintained at 23°C. While no signal was seen without light (a), a prominent spectrum of the DEPMPO/·OH (o symbol labeling central peaks) and ·O2 − (*central peaks) adducts was seen during illumination (b) and abolished partially (50–60%) by catalase (100 U/ml; c) or completely by SOD (1,000 U/ml; d). Trolox (2 mM) quenched these illumination-dependent signals by ∼60 ± 10% and produced a superimposed intense seven-line EPR signal of the Trolox-derived phenoxyl radical (e). Each spectrum is the sum of 24 1-min sequential acquisitions.

