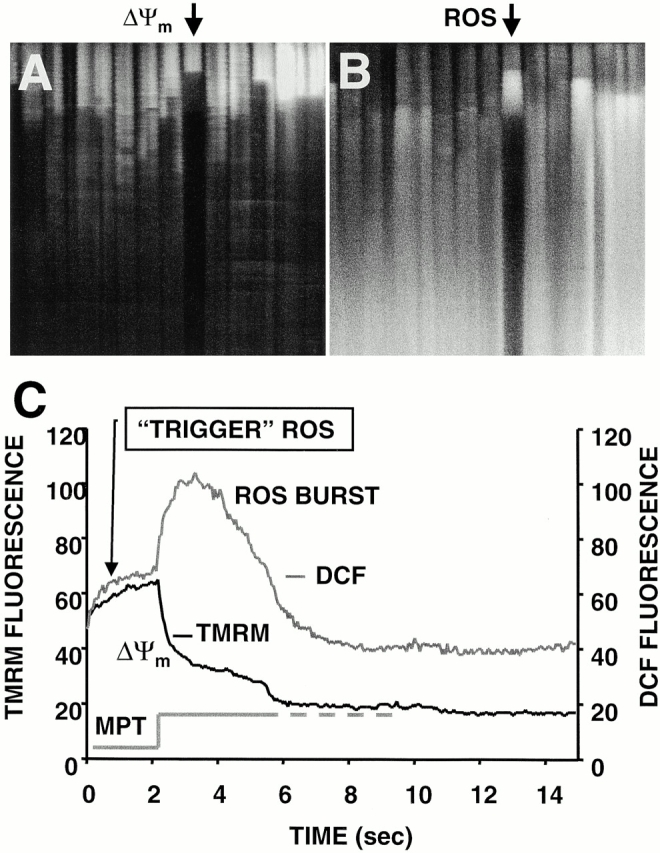
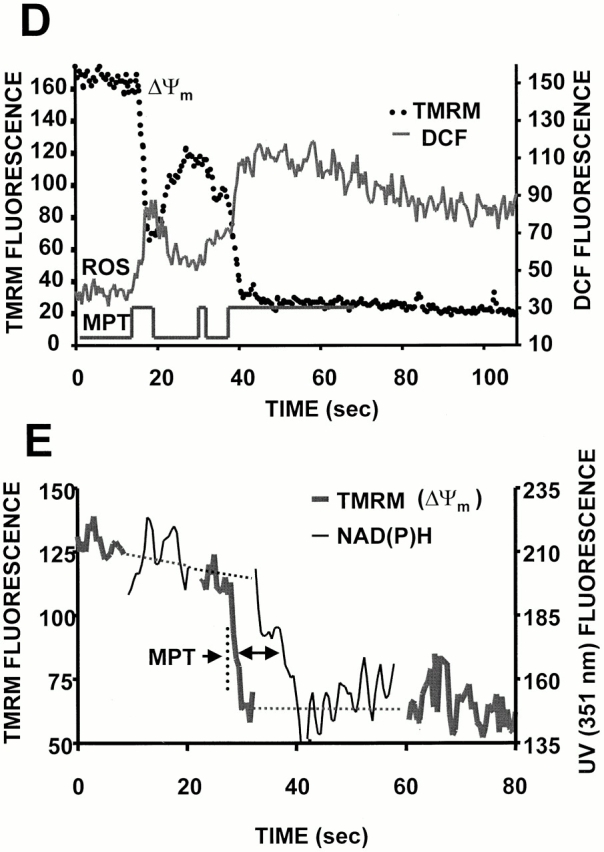
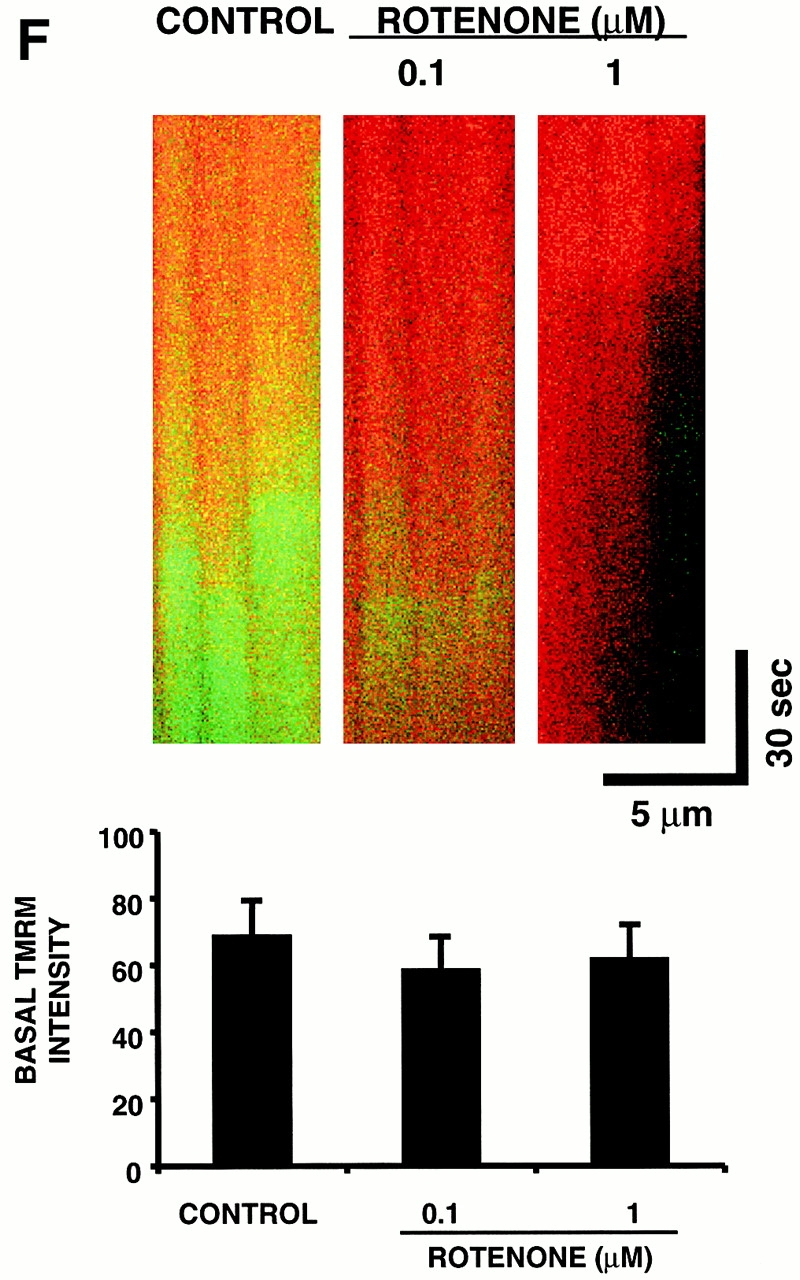
Figure 4.


RIRR in single mitochondria. Representative cell that was dual-loaded with 125 nM TMRM (for ΔΨ) and 10 μM DCF (for ROS). (A) Typical pattern of ΔΨ dissipation at 10 Hz line-scan imaging. (B) Generation of ROS, as indicated by the increase in DCF fluorescence (acquired simultaneously with A). (C) Temporal relationship between ΔΨ and ROS production from the mitochondrial pair denoted by arrows in A and B. The trace at the bottom shows the hypothetical opening of the MPT pore. (D) Coordinated flickering of ΔΨ and RIRR in a single mitochondrion at 2 Hz line-scan imaging. (E) Relationship between ΔΨ and NAD(P) redox state during the MPT. ΔΨ and the MPT are assessed by changes in the TMRM (125 nM) fluorescence and the intrinsic autofluorescence excited at 351 nm (index of NAD[P] redox state), respectively, during 2 Hz line-scan imaging. (F) Inhibition of mitochondrial electron transport at Complex I prevents the mitochondrial ROS burst after induction of the MPT. Cell loading with TMRM and DCF and line-scan imaging protocol, as in D, except for the exposure to rotenone (0.1 and 1 μM) as indicated. Representative regions (encompassing groups of about six mitochondria over three sarcomeres) from the respective 2 Hz line-scan protocols are shown from each experimental group (top panel).
