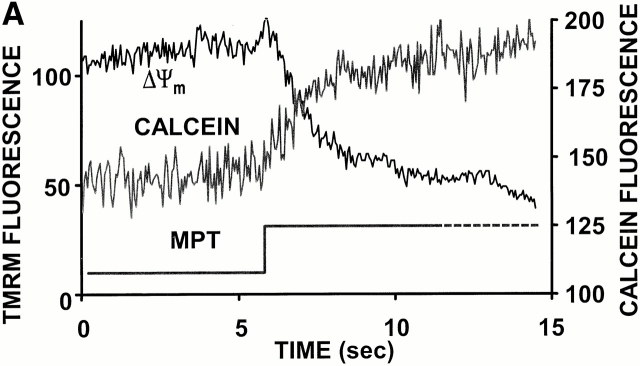
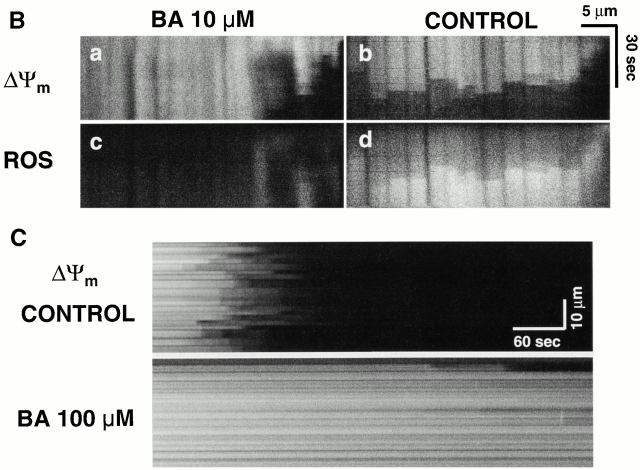
Figure 6.
Demonstration of MPT induction by photoexcited trigger ROS. (A) Cells dual-loaded with TMRM (ΔΨ) and calcein-AM (the latter loaded under conditions that results in a cytosolic distribution initially in excess over that in mitochondria); line-scan imaging at 20 Hz. (B) 10 μM BA partially inhibits the MPT (ΔΨ; a and b) and RIRR (ROS; c and d) versus control. Cells were dual-loaded with TMRM and DCF; line-scan imaging at 2 Hz. (C) 100 μM BA completely inhibits the MPT versus control. Cells are loaded with 125 nM TMRM; line-scan at 2 Hz.


