Figure 7.
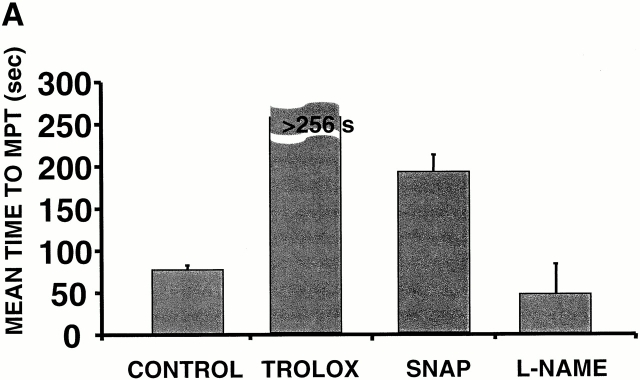
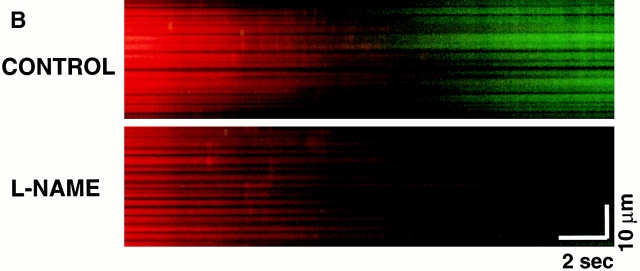
Scavenging the ROS trigger or exposure to exogenous NO inhibits the MPT. Cells loaded with 125 nM TMRM and confocal line-scan–imaged at 2 Hz. (A) Mean time to MPT induction in control versus pretreated cells as indicated: Trolox (2 mM); SNAP (100 μM); L-NAME (1 mM). Data represent the average from 8–10 cells in each group. (B) Evidence of endogenous production of NO by mitochondria after MPT induction and inhibition by L-NAME (4 mM). Myocytes were loaded with 125 nM TMRM (red) and 10 mM DAF-2 (green) and line scanned at 100 Hz.


